GribStream Code: gefsatmos
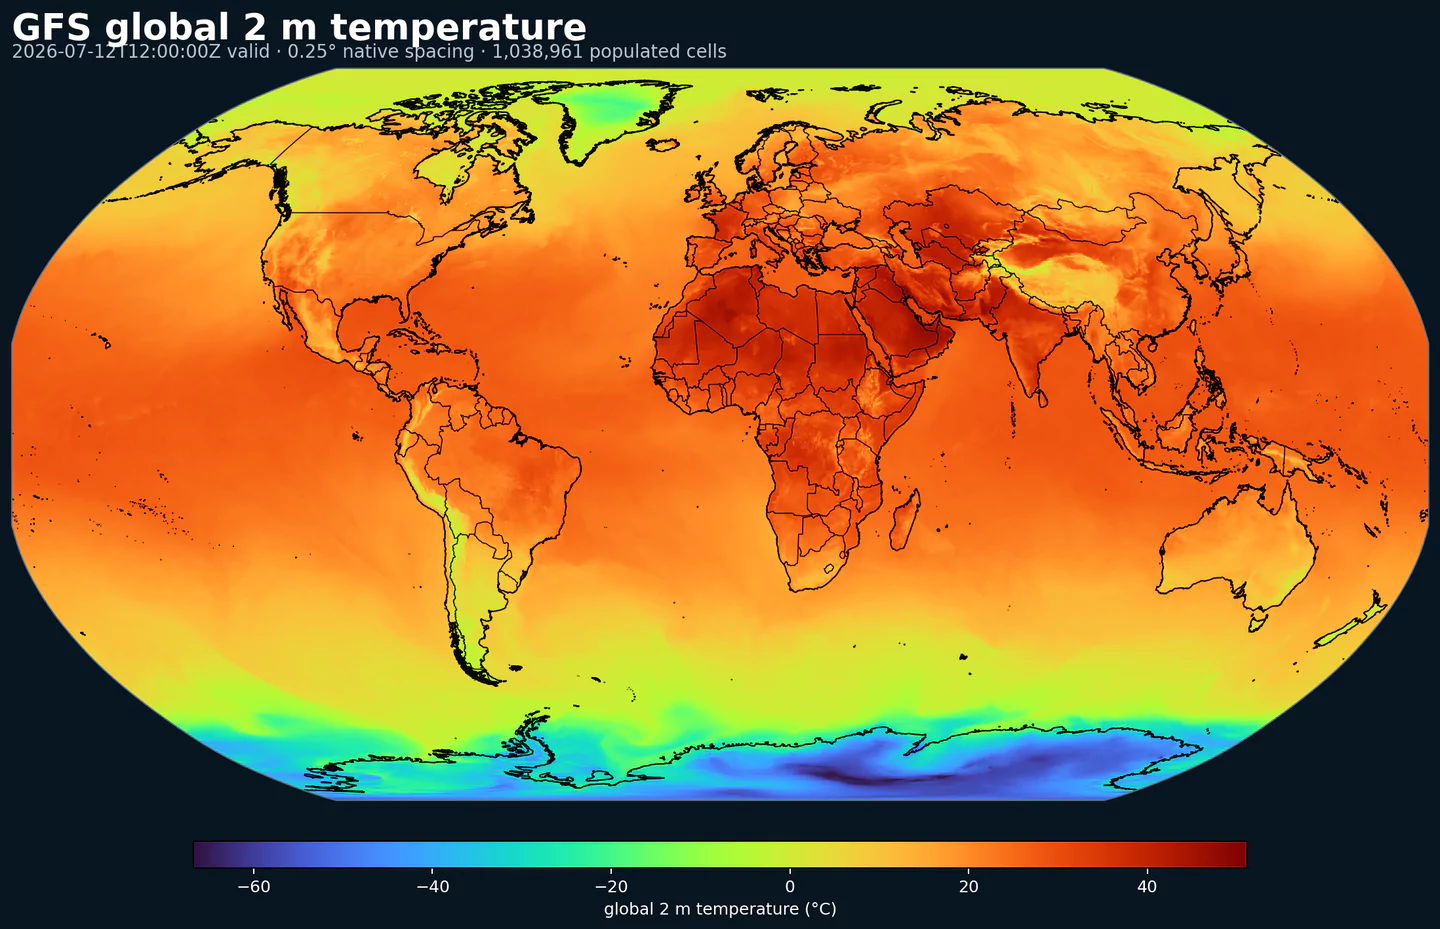
Representative global coverage: GFS 2 m temperature at its native 0.25 degree output spacing, with country boundaries overlaid. This coverage reference was generated from gfs for the gefsatmos page; available variables may differ.
Description
GEFS Atmos is NOAA/NCEP’s medium-range atmospheric ensemble. Each cycle runs the GFS 31 times, one control plus 30 perturbed members, to quantify forecast uncertainty. Version 12 uses the FV3 dynamical core and upgraded
physics, with stochastic schemes such as SPPT and SKEB applied to represent model uncertainty. Initial condition perturbations and flow-dependent errors are generated consistently with the GFS analysis, producing spread that reflects realistic uncertainty growth.
Output includes surface and pressure-level fields for temperature, wind, humidity, precipitation, MSLP, geopotential height, CAPE and related diagnostics.
Detail
Archive begins: 2020-10-01Product page: https://www.ncei.noaa.gov/products/weather-climate-models/global-ensemble-forecastKey Features:
31 members per cycle, control plus 30 perturbations.
FV3 core with stochastic physics (SPPT, SKEB), upgraded microphysics.
Four cycles daily: 00, 06, 12, 18 UTC.
Lead times: 0–240 h, 3-hourly steps.
Related sets: GEFS Atmos Mean , GEFS Wave Prob .
Resolution: 0.25° global grid.Primary Uses: probabilistic risk assessment, scenario planning, renewable energy supply forecasting, aviation and marine routing, hydrology and severe-weather thresholds, skill and reliability studies.
Parameters
Click a parameter to reveal variants in a compact table with ready-to-copy JSON selectors.
CAPE
– Convective Available Potential Energy (J/kg)
2 variants
Convective Available Potential Energy (CAPE) quantifies buoyant energy available to rising air parcels. Larger values generally imply stronger potential updrafts and greater convective intensity.
Units: J/kg.
Often used with CIN and lifting mechanisms to assess thunderstorm potential.
Level
Info
Horizon
Introduced
Selector
180-0 mb above ground0h-240h
2020-10-01
{"name":"CAPE","level":"180-0 mb above ground","info":""}
Copy
surface0h-240h
2020-10-01
{"name":"CAPE","level":"surface","info":""}
Copy
CIN
– Convective Inhibition (J/kg)
2 variants
Convective Inhibition (CIN) measures the energy barrier that must be overcome to initiate convection. More negative values indicate a stronger cap that can suppress storms.
Units: J/kg.
When CIN is weak and CAPE is high, convection is more likely.
Level
Info
Horizon
Introduced
Selector
180-0 mb above ground0h-240h
2020-10-01
{"name":"CIN","level":"180-0 mb above ground","info":""}
Copy
surface0h-240h
2020-10-01
{"name":"CIN","level":"surface","info":""}
Copy
DPT
– Dew Point Temperature (K)
1 variant
Dew point temperature is the temperature at which the air becomes saturated. It is a direct measure of moisture content.
Units: K.
When dew point is close to air temperature, fog or low cloud potential increases.
Level
Info
Horizon
Introduced
Selector
2 m above ground0h-240h
2020-10-01
{"name":"DPT","level":"2 m above ground","info":""}
Copy
GUST
– Wind Speed (Gust) (m/s)
1 variant
Wind gust is the peak short-duration wind speed. It captures brief, hazardous bursts that can exceed sustained winds.
Level
Info
Horizon
Introduced
Selector
surface0h-240h
2020-10-01
{"name":"GUST","level":"surface","info":""}
Copy
HGT
– Geopotential Height (gpm)
2 variants
Geopotential height is the altitude of a pressure surface in the atmosphere. It is the primary field for identifying ridges, troughs, and large‑scale flow patterns.
Level
Info
Horizon
Introduced
Selector
cloud ceiling0h-240h
2022-10-18
{"name":"HGT","level":"cloud ceiling","info":""}
Copy
surface0h
2020-10-01
{"name":"HGT","level":"surface","info":""}
Copy
HLCY
– Storm Relative Helicity (m^2/s^2)
1 variant
Storm-relative helicity measures the potential for streamwise vorticity to be ingested by a storm updraft. Higher values suggest a greater likelihood of rotating updrafts.
Units: m^2/s^2.
Commonly evaluated in the lowest 1 to 3 km layer.
Level
Info
Horizon
Introduced
Selector
3000-0 m above ground0h-240h
2020-10-01
{"name":"HLCY","level":"3000-0 m above ground","info":""}
Copy
ICETK
– Ice Thickness (m)
1 variant
Ice thickness is the physical thickness of sea or lake ice. It is important for marine navigation and heat exchange.
Level
Info
Horizon
Introduced
Selector
surface0h-240h
2020-10-01
{"name":"ICETK","level":"surface","info":""}
Copy
PRES
– Pressure (Pa)
1 variant
Pressure is the atmospheric pressure at the specified level. It is a fundamental mass-field variable for dynamics and thermodynamics.
Level
Info
Horizon
Introduced
Selector
surface0h-240h
2020-10-01
{"name":"PRES","level":"surface","info":""}
Copy
PRMSL
– Pressure Reduced to Mean Sea Level (Pa)
1 variant
Pressure reduced to mean sea level is MSLP computed from surface pressure and temperature. It is used to locate highs and lows.
Level
Info
Horizon
Introduced
Selector
mean sea level0h-240h
2020-10-01
{"name":"PRMSL","level":"mean sea level","info":""}
Copy
PWAT
– Precipitable Water (kg/m^2)
1 variant
Precipitable water is the total column water vapor from the surface to the top of the atmosphere. It is a key moisture indicator.
Level
Info
Horizon
Introduced
Selector
entire atmosphere (considered as a single layer)0h-240h
2020-10-01
{"name":"PWAT","level":"entire atmosphere (considered as a single layer)","info":""}
Copy
RH
– Relative Humidity (percent)
1 variant
Relative humidity describes how close the air is to saturation at the specified level. High values favor cloud formation.
Units: percent.
Higher values indicate more atmospheric moisture and greater cloud or precip potential.
Level
Info
Horizon
Introduced
Selector
2 m above ground0h-240h
2020-10-01
{"name":"RH","level":"2 m above ground","info":""}
Copy
SNOD
– Snow Depth (m)
1 variant
Snow depth is the physical thickness of the snowpack. It is distinct from snow water equivalent, which measures water content.
Level
Info
Horizon
Introduced
Selector
surface0h-240h
2020-10-01
{"name":"SNOD","level":"surface","info":""}
Copy
SOILW
– Volumetric Soil Moisture Content (Fraction)
1 variant
Volumetric soil moisture is the fraction of soil volume occupied by water. It is commonly used in hydrology and drought monitoring.
Units: Fraction.
Soil state affects evapotranspiration and boundary-layer moisture.
Level
Info
Horizon
Introduced
Selector
0-0.1 m below ground0h-240h
2020-10-01
{"name":"SOILW","level":"0-0.1 m below ground","info":""}
Copy
TMAX
– Maximum Temperature (K)
1 variant
Maximum temperature is the highest temperature reached during the output period. It is commonly used for heat stress and daily extremes.
Level
Info
Horizon
Introduced
Selector
2 m above ground0h-240h
2020-10-01
{"name":"TMAX","level":"2 m above ground","info":""}
Copy
TMIN
– Minimum Temperature (K)
1 variant
Minimum temperature is the lowest temperature reached during the output period. It is commonly used for frost and cold-stress assessment.
Level
Info
Horizon
Introduced
Selector
2 m above ground0h-240h
2020-10-01
{"name":"TMIN","level":"2 m above ground","info":""}
Copy
TMP
– Temperature (K)
1 variant
Air temperature is the thermal state of the atmosphere at the specified level. It influences density, stability, and energy exchange.
Level
Info
Horizon
Introduced
Selector
2 m above ground0h-240h
2020-10-01
{"name":"TMP","level":"2 m above ground","info":""}
Copy
TSOIL
– Soil Temperature (K)
1 variant
Soil temperature describes the thermal state of the soil layer. It affects ground heat flux and freeze/thaw processes.
Units: K.
Soil state affects evapotranspiration and boundary-layer moisture.
Level
Info
Horizon
Introduced
Selector
0-0.1 m below ground0h-240h
2020-10-01
{"name":"TSOIL","level":"0-0.1 m below ground","info":""}
Copy
UGRD
– U-Component of Wind (m/s)
1 variant
U‑component of wind is the east‑west component of the horizontal wind. Combine with v for speed and direction.
Units: m/s.
Combine u and v components to compute speed and direction.
Level
Info
Horizon
Introduced
Selector
10 m above ground0h-240h
2020-10-01
{"name":"UGRD","level":"10 m above ground","info":""}
Copy
VGRD
– V-Component of Wind (m/s)
1 variant
V‑component of wind is the north‑south component of the horizontal wind. Combine with u for speed and direction.
Units: m/s.
Combine u and v components to compute speed and direction.
Level
Info
Horizon
Introduced
Selector
10 m above ground0h-240h
2020-10-01
{"name":"VGRD","level":"10 m above ground","info":""}
Copy
WEASD
– Water Equivalent of Accumulated Snow Depth (kg/m^2)
1 variant
Snow water equivalent (SWE) is the total liquid water stored in the snowpack. It integrates depth and density of existing snow.
Units: kg/m^2.
Accumulations represent water-equivalent depth over the output interval; rates describe intensity.
Level
Info
Horizon
Introduced
Selector
surface0h-240h
2020-10-01
{"name":"WEASD","level":"surface","info":""}
Copy
No parameters match your search.