Ceiling height is the altitude of the lowest cloud base that covers a significant portion of the sky. It is a key aviation and surface-visibility metric.
- Units: m.
urma
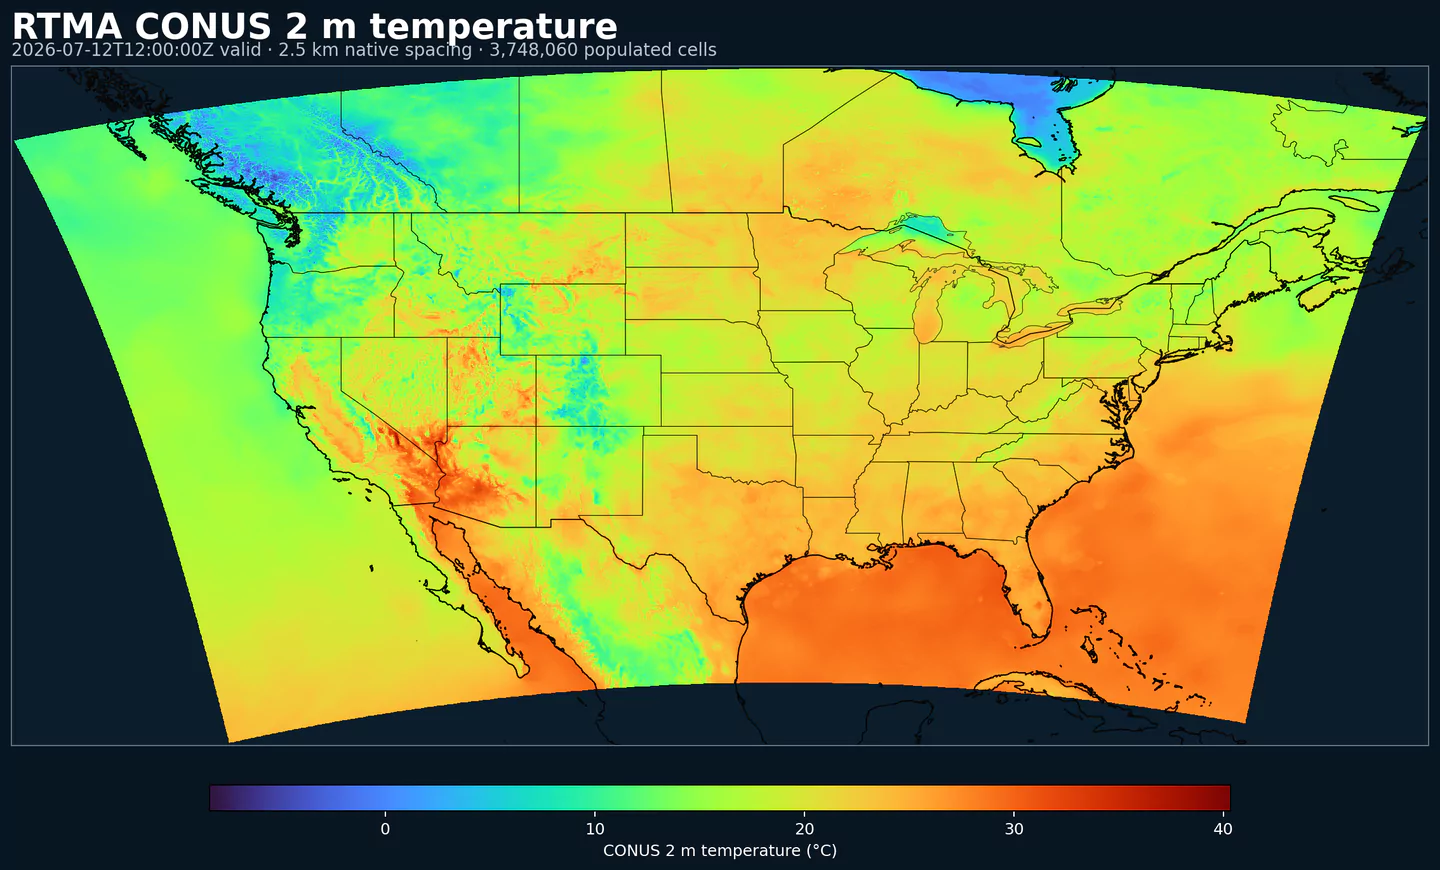
URMA (Unrestricted Mesoscale Analysis) is NOAA's hourly, high-resolution, near-surface “analysis of record.” It reruns the RTMA system approximately six hours after each valid time, assimilating conventional, mesonet, buoy, ship, shelter, and radar-based observations that arrive too late for RTMA. This also includes advanced precipitation QPE from radar and gauge blends, and snowfall updates from NOHRSC, merged via methods like Whittaker blending.
URMA uses a two-dimensional variational (2D-Var) assimilation with static background error covariances (gridpoint-statistical-interpolation, GSI) to combine observations and a first-guess model field. It operates over multiple NDFD Lambert Conformal grids—2.5 km for CONUS (WEXP), ~3 km for Alaska, and similar resolutions for Hawaii, Puerto Rico, and Guam.
The dataset includes standard near-surface fields such as 2 m temperature, dewpoint, specific humidity, 10 m wind (speed, direction, gust), surface pressure, visibility, cloud ceiling, and precipitation. URMA also integrates wave-height fields offshore and daily minimum/maximum temperature. As the analysis of record, it supports forecast verification, NBM bias correction, ML model training, and situational awareness.
URMA is valuable because it can use observations and quality-control steps that are not available in the lower-latency RTMA cycle. Mesonet densification, radar-gauge precipitation blends, and snow-analysis updates make it better suited for verification and training data than for immediate situational awareness.
Notable upgrades: URMA replaced the legacy Stage II precipitation input with MRMS/Multi-Radar QPE and added NOHRSC snow analysis. In Alaska, URMA inputs fed into the AORC system to improve downscaling of temperature, humidity, pressure, and wind products.
Key use cases include: forecast verification and skill score benchmarks, operational dashboarding, bias-corrected model outputs, and generation of high-quality labels for machine learning and post-processing pipelines.
Click a parameter to reveal variants in a compact table with ready-to-copy JSON selectors.
Ceiling height is the altitude of the lowest cloud base that covers a significant portion of the sky. It is a key aviation and surface-visibility metric.
| Level | Info | Horizon | Introduced | Selector |
|---|---|---|---|---|
cloud ceiling |
0h | 2017-05-01 |
{"name":"CEIL","level":"cloud ceiling","info":""}
|
Dew point temperature is the temperature at which the air becomes saturated. It is a direct measure of moisture content.
| Level | Info | Horizon | Introduced | Selector |
|---|---|---|---|---|
2 m above ground |
0h | 2017-05-01 |
{"name":"DPT","level":"2 m above ground","info":""}
|
Wind gust is the peak short-duration wind speed. It captures brief, hazardous bursts that can exceed sustained winds.
| Level | Info | Horizon | Introduced | Selector |
|---|---|---|---|---|
10 m above ground |
0h | 2017-05-01 |
{"name":"GUST","level":"10 m above ground","info":""}
|
Geopotential height is the altitude of a pressure surface in the atmosphere. It is the primary field for identifying ridges, troughs, and large‑scale flow patterns.
| Level | Info | Horizon | Introduced | Selector |
|---|---|---|---|---|
surface |
0h | 2017-05-01 |
{"name":"HGT","level":"surface","info":""}
|
Pressure is the atmospheric pressure at the specified level. It is a fundamental mass-field variable for dynamics and thermodynamics.
| Level | Info | Horizon | Introduced | Selector |
|---|---|---|---|---|
surface |
0h | 2017-05-01 |
{"name":"PRES","level":"surface","info":""}
|
Specific humidity is the mass of water vapor per mass of air at the specified level. It is central to moisture transport.
| Level | Info | Horizon | Introduced | Selector |
|---|---|---|---|---|
2 m above ground |
0h | 2017-05-01 |
{"name":"SPFH","level":"2 m above ground","info":""}
|
Air temperature is the thermal state of the atmosphere at the specified level. It influences density, stability, and energy exchange.
| Level | Info | Horizon | Introduced | Selector |
|---|---|---|---|---|
2 m above ground |
0h | 2017-05-01 |
{"name":"TMP","level":"2 m above ground","info":""}
|
U‑component of wind is the east‑west component of the horizontal wind. Combine with v for speed and direction.
| Level | Info | Horizon | Introduced | Selector |
|---|---|---|---|---|
10 m above ground |
0h | 2017-05-01 |
{"name":"UGRD","level":"10 m above ground","info":""}
|
V‑component of wind is the north‑south component of the horizontal wind. Combine with u for speed and direction.
| Level | Info | Horizon | Introduced | Selector |
|---|---|---|---|---|
10 m above ground |
0h | 2017-05-01 |
{"name":"VGRD","level":"10 m above ground","info":""}
|
Horizontal visibility at the surface. Lower values indicate reduced visibility due to fog, precipitation, or aerosols.
| Level | Info | Horizon | Introduced | Selector |
|---|---|---|---|---|
surface |
0h | 2017-05-01 |
{"name":"VIS","level":"surface","info":""}
|
Wind direction indicates the direction from which the wind is blowing at the specified level.
| Level | Info | Horizon | Introduced | Selector |
|---|---|---|---|---|
10 m above ground |
0h | 2017-05-01 |
{"name":"WDIR","level":"10 m above ground","info":""}
|
Wind speed is the magnitude of the horizontal wind at the specified level. It is used for transport, mixing, and hazards.
| Level | Info | Horizon | Introduced | Selector |
|---|---|---|---|---|
10 m above ground |
0h | 2017-05-01 |
{"name":"WIND","level":"10 m above ground","info":""}
|
No parameters match your search.