
GribStream Blog
Six AIWP global AI forecast datasets now available on GribStream
Compare Pangu-Weather, FourCastNet v2-small, and GraphCast forecasts initialized from GFS and IFS on a common 0.25 degree global grid through 10 days.
GribStream now provides six near-real-time datasets from the AI Weather Prediction (AIWP) model reforecast archive: Pangu-Weather, FourCastNet v2-small, and GraphCast Operational, each initialized from both GFS and IFS analyses.
This is a particularly useful comparison set. The three model families use different learning architectures, while the paired initial conditions let researchers examine how the same model evolves from two independently produced estimates of the atmosphere. Every product uses the same 0.25 degree global grid, 6-hour forecast spacing, 00 and 12 UTC cycles, and 10-day horizon.
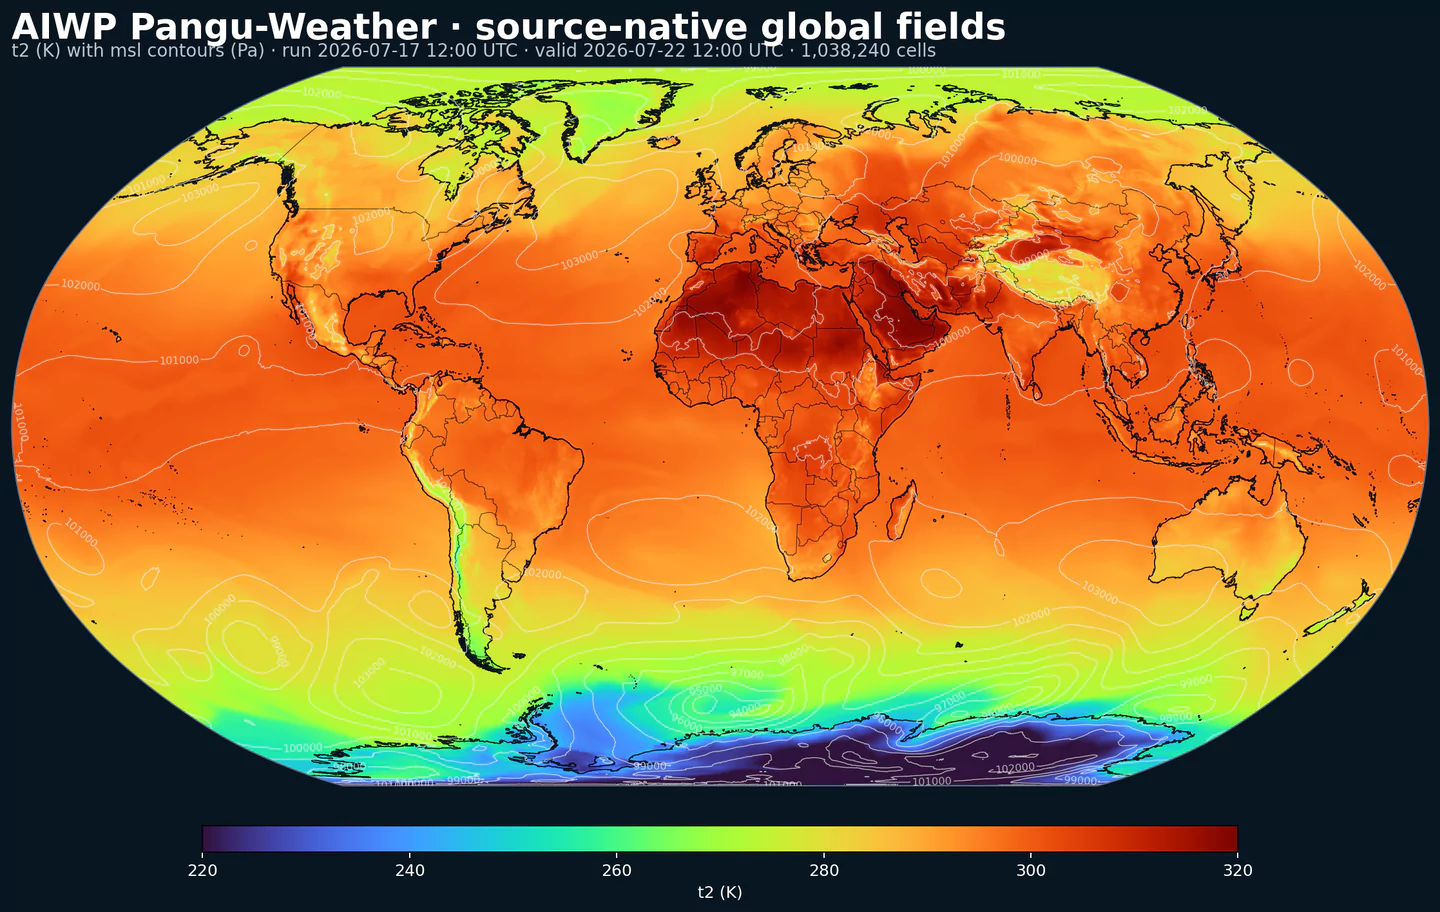
t2 in K with msl contours in Pa from the Pangu-Weather GFS cycle of July 17, 2026 at 12 UTC, forecast hour 120. The plot uses all 1,038,240 cells of the shared 0.25 degree global grid.Six Datasets, Three Model Families
The AIWP archive is produced collaboratively by CIRA and NOAA Global Systems Laboratory for community evaluation of data-driven global weather models. It publishes near-real-time cycles twice daily and deliberately begins each archive after the corresponding model's training or fine-tuning period.
| GribStream code | Experiment | Fields per forecast time |
|---|---|---|
aiwppangu |
Pangu-Weather · GFS | 69 — specific humidity on 13 pressure levels |
aiwppanguifs |
Pangu-Weather · IFS | 69 — same Pangu field set from IFS analyses |
aiwpfourcastnet |
FourCastNet v2-small · GFS | 73 — relative humidity, 100 m wind, surface pressure, total-column water vapour |
aiwpfourcastnetifs |
FourCastNet v2-small · IFS | 73 — same FourCastNet field set from IFS analyses |
aiwpgraphcast |
GraphCast Operational · GFS | 83 — vertical velocity and 6-hour accumulated precipitation |
aiwpgraphcastifs |
GraphCast Operational · IFS | 83 — atmospheric fields from hour 6; precipitation from hour 12 |
Coverage for all six GribStream datasets begins with the May 27, 2025 00 UTC cycle. The archive is not continuous: some upstream cycles are absent, so use the catalog or available forecasted_at values rather than assuming every 00 and 12 UTC cycle exists.
What the GFS and IFS Pairs Let You Study
An AI forecast does not begin from raw observations. It begins from an analyzed atmospheric state produced by a data-assimilation system. The GFS-initialized and IFS-initialized branches therefore answer a valuable question: how does the same learned forecast model evolve when its starting atmosphere comes from a different analysis system?
Matched comparisons can reveal sensitivity in cyclone position, pressure patterns, thermal structure, wind, and moisture. They should not be interpreted as a pure ranking of GFS versus IFS, however. The analyses may differ in observations, assimilation, model physics, and timing. Verification against observations or an appropriate reference analysis is still required.
Three Different Ways to Model Global Weather
Pangu-Weather treats pressure levels as a third spatial dimension in a 3D Earth-specific transformer. Its hierarchical temporal aggregation combines networks for 1, 3, 6, and 24-hour advances, reducing the number of iterative steps needed to reach medium range. The Pangu-Weather paper describes the architecture and its historical evaluation.
FourCastNet v2-small uses a spherical Fourier neural operator. Its global spectral operations are formulated directly for the sphere and were designed to improve stability during repeated autoregressive forecasts. The spherical Fourier neural operator paper explains the method.
GraphCast uses a graph neural network on a multi-scale mesh. It encodes the latitude-longitude atmospheric state onto that mesh, advances the state by 6 hours, and decodes the result back to the global grid. The GraphCast paper documents the model and its evaluation.
Published results from those papers provide scientific context, not guaranteed accuracy for the current AIWP cycles. Initial conditions, evaluation periods, and verification targets matter.
Choosing the Right AIWP Dataset
Use Pangu-Weather when you want its compact atmospheric state, including specific humidity, for circulation and moisture-transport studies. Its published field set does not include precipitation, clouds, radiation, or surface fluxes.
Use FourCastNet v2-small when relative humidity, 100 metre wind, surface pressure, or total-column water vapour matter. Its field set does not include precipitation or vertical velocity.
Use GraphCast when 6-hour accumulated precipitation or pressure-level vertical velocity is required. In aiwpgraphcastifs, the source's first two apcp records are missing throughout the grid, so the generated inventory begins at forecast hour 12 for precipitation and hour 6 for the other fields.
All six are deterministic research forecasts. They do not provide ensemble probabilities or a complete accounting of forecast uncertainty. For operational decisions, compare them with observations, ensembles, and authoritative current guidance.
One API Shape Across All Six
The same /runs and /timeseries request structure works for every dataset. This request selects the July 17 12 UTC Pangu-Weather GFS cycle at forecast hour 120 for New York City:
{
  "timesList": ["2026-07-17T12:00:00Z"],
  "minLeadTime": "120h",
  "maxLeadTime": "120h",
  "coordinates": [
    {"lat": 40.7128, "lon": -74.0060, "name": "New York City"}
  ],
  "variables": [
    {"name": "t2", "level": "", "info": "", "alias": "temperature_k"},
    {"name": "msl", "level": "", "info": "", "alias": "pressure_pa"},
    {"name": "z", "level": "500 hPa", "info": "", "alias": "geopotential_m2_s-2"}
  ]
}
Use dataset code aiwppangu with that example. To switch models or initial conditions, change the dataset code and choose selectors from the corresponding generated inventory; variable sets are intentionally not forced into a common artificial vocabulary.
Attribution and Research Boundaries
The registry labels AIWP as open data with no restrictions on use, while warning that data may be missing and availability is not guaranteed. It asks users to cite the AIWP archive paper. These products are evaluation output—not official operational NOAA or ECMWF forecasts.
Treat these as experimental research feeds. The public README says the data are provided as-is and documents earlier file regeneration, uncertain publication timing, and a directory-structure change. Do not make an AIWP feed the sole dependency for an availability-sensitive system: monitor forecasted_at freshness and keep an operational fallback dataset.
Authoritative sources and next steps:
- AIWP Registry of Open Data on AWS: https://registry.opendata.aws/aiwp/
- AIWP public README: https://noaa-oar-mlwp-data.s3.amazonaws.com/README.txt
- AIWP archive paper: https://doi.org/10.1175/BAMS-D-24-0057.1
- Pangu-Weather paper: https://doi.org/10.1038/s41586-023-06185-3
- FourCastNet v2-small method: https://arxiv.org/abs/2306.03838
- GraphCast paper: https://doi.org/10.1126/science.adi2336
- GribStream model catalog
- GribStream API documentation