
GribStream Blog
BARRA2: what 4.4 km reanalysis can reveal about Australia's weather
Explore the science behind Australia's BARRA2 reanalysis and its uses in wind energy, extreme-weather research and historical climate analysis.
How often do several Australian wind farms experience weak winds together? What weather preceded a damaging fire, a heatwave or a period of unusually high electricity demand? Answering these questions requires more than a forecast for tomorrow. It requires a consistent reconstruction of weather across many years and locations.
BARRA2, the Bureau of Meteorology's regional reanalysis, was developed to make that historical picture more detailed over Australia. Its BARRA-C2 component covers the country at approximately 4.4 km, bringing a regional view to questions that are difficult to answer from sparse observations or coarser global datasets alone. Its availability through AWS Open Data makes this scientific resource more accessible.
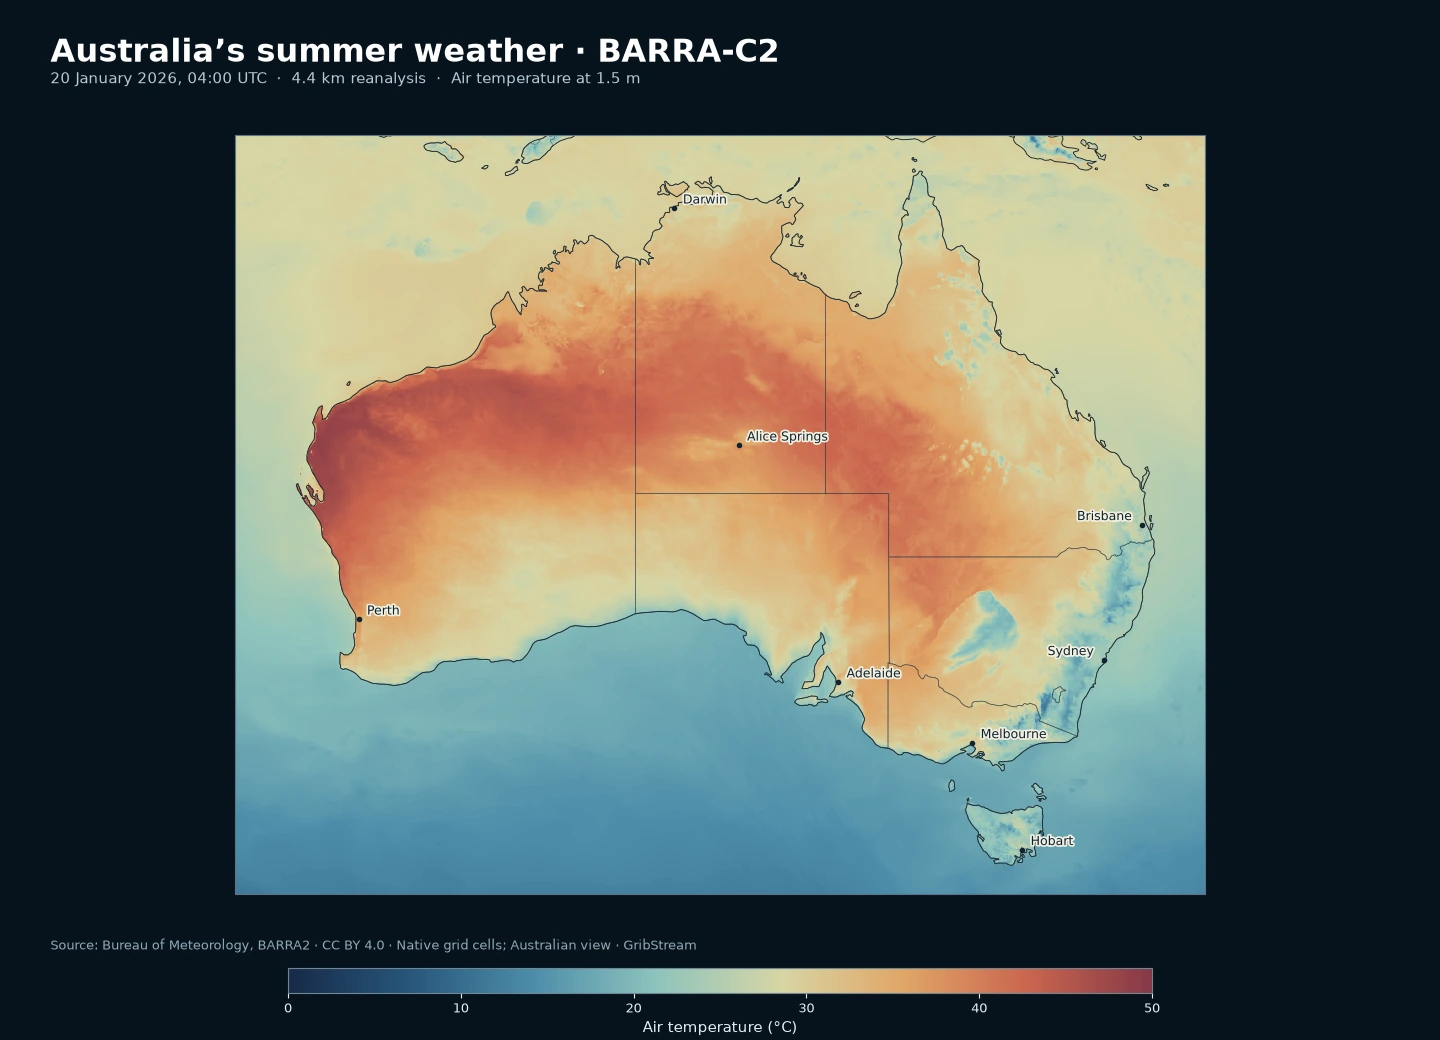
Reconstructing the weather between observations
Weather stations tell us what happened at particular locations. Satellites provide much broader coverage, but neither observes every atmospheric variable everywhere and at every time. Reanalysis combines observations with a physical model to reconstruct a spatially consistent history.
The Bureau's BARRA overview describes a system designed for Australian weather and its impacts. BARRA2 extends the record back to 1979, updates the model physics and observations, and expands kilometre-scale coverage to the whole country.
The resulting fields are estimates of past weather, not measurements at every grid point. That distinction is especially important when examining local extremes or comparing a reconstructed event with an individual weather station.
C2 or R2: which view of past weather fits your question?
The names distinguish two approaches within BARRA's second generation. R2 is the regional reanalysis: a 12 km reconstruction covering Australia, New Zealand and the maritime continent. C2 is the convection-scale downscaling: a finer, 4.4 km reconstruction over Australia that can explicitly simulate convective storms. Both describe past weather; neither is a forecast.
The Bureau's overview and scientific documentation distinguish these products and a third, ensemble product:
| Product | Approximate grid spacing | What it contributes |
|---|---|---|
| BARRA-R2 | 12 km | A deterministic regional reanalysis covering Australia and surrounding regions |
| BARRA-RE2 | 24 km | An ensemble for investigating uncertainty in reconstructed atmospheric conditions |
| BARRA-C2 | 4.4 km | Convection-scale downscaling over Australia, with finer spatial and temporal detail |
For broad regional conditions and comparisons across distant sites, R2 is a useful starting point. For questions involving local terrain, coastlines or storm structure within Australia, C2 offers finer spatial detail. This is a guide to choosing what to evaluate, not a claim that C2 is always more accurate. The wind-energy study below, for example, evaluated R2 specifically. GribStream's initial release includes C2 and R2; RE2 is not included.
The BARRA2 project documentation explains how the regional systems fit together. ERA5 supplies the larger-scale boundary conditions. BARRA2 adds regional modelling detail within that context, so comparisons with ERA5 are useful but should not treat the two as independent accounts of the atmosphere.
What changes when storms can develop explicitly?
The Bureau's C2 development report describes a major distinction: BARRA-C2 explicitly models convection, while R2 uses a parameterisation to represent its effects. This lets researchers investigate aspects of storm formation, intensity and evolution that are not represented in the same way by BARRA-R2. Selected outputs are available every 20 minutes, alongside hourly products.
That creates possibilities for studying the evolution of short-lived hazardous weather, rather than seeing only a daily total. It also changes how some familiar diagnostics should be interpreted. The BARRA2 scientific FAQ explains that an explicitly simulated storm can consume instability and alter its surroundings. A low value of convective available potential energy after a storm develops does not necessarily mean the earlier environment was unfavourable for a storm.
The opportunity is richer process information. It is not a guarantee that every individual historical storm is reconstructed at exactly the observed place and time.
Wind energy: evidence from 54 Australian wind farms
There is already published evidence for an energy application. Palmer and colleagues' 2025 study compared simulated wind generation with observed output from 54 Australian wind farms, using site-specific turbine specifications. It evaluated BARRA-R2, MERRA-2 and ERA5.
BARRA-R2 performed best overall under the study's assessment of bias, correlation and error. However, results varied substantially between sites, and simulated generation could diverge from observations. Correcting an annual bias did not remove all the errors in the distribution of wind power.
This supports evaluating BARRA-R2 for Australian wind-energy modelling. It does not establish that BARRA-C2 has the same measured advantage: that product was not the subject of this comparison. For a new project, local calibration and uncertainty estimates remain part of the analysis.
From past weather to practical questions
The Bureau identifies applications in fire research, renewable energy, agriculture and extreme-weather studies. Building on those uses, BARRA2 could help investigate questions such as:
- Energy portfolios: how frequently low wind affects several sites together, and how those periods coincide with temperature-driven demand. This asks about timing and spatial dependence, not just annual averages.
- Extreme-weather exposure: how wind, heat, humidity and rainfall evolved around a past event, and whether similar combinations recur elsewhere in the historical record.
- Agriculture: how frost, heat or rainfall patterns vary across a region, using local observations to assess the reconstruction at the places where decisions are made.
These are possible analyses, not validation results for every BARRA2 field. The value comes from matching the product, variable and time scale to the question.
A detailed historical reference, with known limits
Higher resolution does not remove model bias. The published BARRA2 issues include limitations in wind gusts, tropical-cyclone intensity and some convective parameters, as well as effects near the edges of the modelling domain. The initial January–February 1979 period also requires care because of model spin-up.
For a credible assessment, compare relevant variables with observations and keep track of the product and version used. A strong result for regional wind generation cannot automatically be extended to hail, rainfall extremes or a single mountain site.
Explore BARRA2 with GribStream
GribStream's initial BARRA2 release makes 28 hourly fields available in each of BARRA-C2 at 4.4 km and BARRA-R2 at 12 km, from January 1992 through January 2026. You can query historical time series using the same interface as ERA5.
The initial selection focuses on practical weather and energy questions:
- Temperature and humidity: air temperature at 1.5 m, its hourly minimum and maximum, surface temperature, air temperature at 100 m, and near-surface relative and specific humidity.
- Wind: 10 m wind speed and components, maximum wind gusts, and wind components at 100, 150 and 200 m for investigating conditions at turbine heights.
- Water and radiation: total precipitation and snowfall rates, evapotranspiration, incoming total and direct solar radiation, and incoming longwave radiation.
- Weather context: surface and mean sea-level pressure, total cloud cover, and the convection diagnostics CAPE and CIN.
This initial offering covers selected hourly fields. The broader parameter set and the 20-minute, three-hourly, daily and monthly products discussed above are not yet part of GribStream's available inventory. The model pages list the exact fields, units and coverage for each product.
We plan to expand to all C2/R2 parameters and the full available historical record back to 1979 soon. Contact us for more information, or tell us which additional variables and years would help your project.
Choose the product, variables and locations that fit your question, then assess the reconstructed conditions against relevant local observations. From heat exposure to renewable-energy variability, the scientific value lies in understanding both the detail this record offers and its limits.