GribStream Blog
GribStream MCP now queries live weather data for AI analysis
GribStream MCP now lets AI agents query authenticated HRRR weather model data, receive CSV results, analyze forecast grids, and render maps or animations directly from a chat session.
AI weather analysis is much more useful when the agent can work with real forecast data instead of only explaining how an API call should look.
GribStream MCP now supports authenticated data queries. That means an AI agent in Codex, Claude Code, Claude, or another MCP-capable client can inspect the GribStream catalog, choose exact weather-model variables, pull forecast rows as CSV, JSON, or NDJSON, and then analyze or plot the returned data inside the same session.
This turns GribStream MCP into an interactive weather-data workflow:
- discover datasets and selector metadata from the live catalog
- query bounded
/timeseriesor/runsresults with an authenticated GribStream token - sort and validate the returned weather rows
- use normal local tools such as pandas and matplotlib for analysis
- refine the request, the plot, or the meteorological question without leaving the chat
For weather API users, this is a faster path from idea to evidence. Product teams can prototype a visualization. Forecast teams can sanity-check a field. Energy, logistics, agriculture, aviation, and weather-risk teams can ask for a quick event view before committing to a larger export or production pipeline.
A one-shot HRRR storm animation
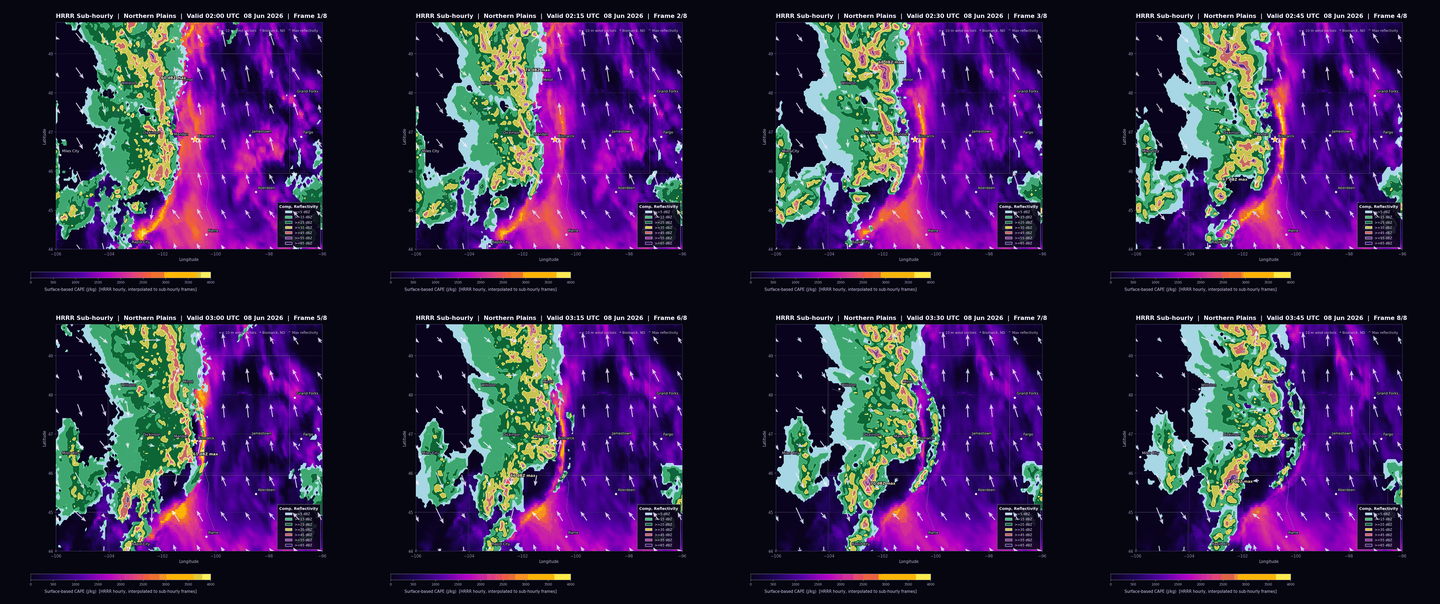
To test the new flow, we asked an MCP-capable AI client for a polished animated weather map of a Northern Plains convective event near Bismarck, North Dakota. The prompt did not assume GribStream repo knowledge or hard-code the exact variable selectors. It asked the agent to discover the fields from the MCP catalog, query the data, stitch tiled CSV responses if needed, and render the final GIF.
Here is the prompt:
Use the GribStream MCP to make me a polished animated weather GIF of the Northern Plains storm near Bismarck, North Dakota, from 02:00 UTC through 03:45 UTC on June 8, 2026.

Please discover the right HRRR variables from the MCP catalog instead of assuming names. I want surface-based CAPE as the shaded background, composite reflectivity overlaid as filled/contoured storm shapes, and 10 meter wind vectors from the u/v wind components.

Use about 5 km resolution, roughly 0.05 degrees, over a wide enough box to show the storm environment and motion around western and central North Dakota. Include Bismarck, Minot, Williston, Dickinson, Jamestown, Fargo, Grand Forks, Aberdeen, Pierre, Rapid City, and Miles City as city labels if they fit. Add readable state borders, a dark background, a purple-to-yellow CAPE color scale, a reflectivity legend, and mark the maximum reflectivity point in each frame.

Please make the animation visually clean and presentation-ready: constant map bounds, constant color scales, readable labels, not too many wind arrows, and a moderately quick loop. Prefer CSV responses from the MCP. If the grid is too large for one response, tile the request, stitch the CSVs back together, sort the rows by valid time and location, and then render the GIF.

Save the final animated GIF, plus a still preview frame and a contact sheet, and show me where they are.
For the animation at the top of this post, the agent used the MCP catalog to find the needed HRRR fields, then queried:
| Dataset | Fields | Valid times | Resolution | Rows |
|---|---|---|---|---|
| HRRR Sub-hourly | Composite reflectivity, 10 m U wind, 10 m V wind | 8 frames from 02:00Z through 03:45Z | 0.05 degrees | 188,136 |
| HRRR | Surface CAPE | 02:00Z, 03:00Z, 04:00Z | 0.05 degrees | 70,551 |
Download the CSV outputs used for the render:
A contact sheet is also useful when reviewing animation frames:
What changed in the MCP
The GribStream MCP already helped AI tools build correct API requests from live catalog metadata. The new capability is that authenticated query tools can now return actual forecast values, not just request templates.
That matters because weather data is selector-heavy. A model field is not just a short name. It also has a level, metadata, time semantics, units, dataset coverage, and sometimes model-specific quirks. The MCP gives an agent a way to discover those details before it queries data.
For the Bismarck animation, the agent discovered and used:
| Weather ingredient | Model selector |
|---|---|
| Surface-based CAPE | CAPE, surface, "" from HRRR |
| Composite reflectivity | REFC, entire atmosphere, "" from HRRR Sub-hourly |
| 10 m U wind | UGRD, 10 m above ground, "" from HRRR Sub-hourly |
| 10 m V wind | VGRD, 10 m above ground, "" from HRRR Sub-hourly |
The plotting step is ordinary data science after that: read CSV with pandas, sort by valid time and grid location, pivot each frame, compute wind vectors from the U/V components, and render a constant-scale map.
Why this is useful
This is not a replacement for the GribStream API. The API remains the right interface for large exports, scheduled jobs, backend services, and production weather applications.
The MCP is the interactive layer. It is useful when a user wants to ask a question such as:
- "Find a visually interesting HRRR event and make a map."
- "Pull the exact CSV behind this forecast feature."
- "Compare CAPE, reflectivity, and surface wind around this storm."
- "Show me whether this grid has the field I need before I wire it into production."
- "Build a first-pass plot that I can turn into a real dashboard."
That is valuable for teams building weather dashboards, renewable-energy forecasts, logistics risk tools, agriculture decision support, aviation products, and insurance analytics. The agent can move from natural language to catalog-backed weather data, then to an inspectable chart, without a human writing the first curl command or plotting script by hand.
Try it
Install or connect the GribStream MCP in your AI client, authenticate with a GribStream API token, and start with a bounded data request. For example:
Use the GribStream MCP to find a visually interesting HRRR weather-data example.
Use catalog tools to choose the variables, query a bounded CSV result,
sort the returned rows, and render a plot from the data.
Keep the first pull small enough to iterate quickly.
Then ask for the production-grade version:
Make the map presentation-ready.
Use a dark background, readable labels, a fixed color scale,
a clear legend, and wind vectors large enough to inspect.
If the grid is too large for one response, tile the query and stitch the CSVs.
The important change is simple: GribStream MCP can now participate in the live weather-data analysis loop. It can discover, query, return, and help visualize real forecast data.
Notes
The graphics above use HRRR model output, not observed radar. Composite reflectivity is the model field REFC. Wind arrows are derived from UGRD and VGRD at 10 m above ground. The CAPE field comes from hourly HRRR data and is interpolated for the 15-minute sub-hourly frames.