
GribStream Blog
A global weather-satellite mosaic, updated every hour
NOAA GMGSI brings visible, shortwave infrared, water-vapor, and longwave infrared imagery together in one near-global hourly mosaic on GribStream.
Most geostationary weather-satellite products present the view from one spacecraft over one region. NOAA's Global Mosaic of Geostationary Satellite Imagery (GMGSI) takes a different approach: it combines the operational satellites watching the Americas, Europe and Africa, and Asia-Pacific into one picture every hour.
The new gmgsi dataset makes that near-global view available on GribStream from July 22, 2026 at 15:00 UTC onward. It spans approximately 72.7°S to 72.7°N on a fixed 4,999 by 3,000 Mercator grid with about 8 km horizontal resolution.
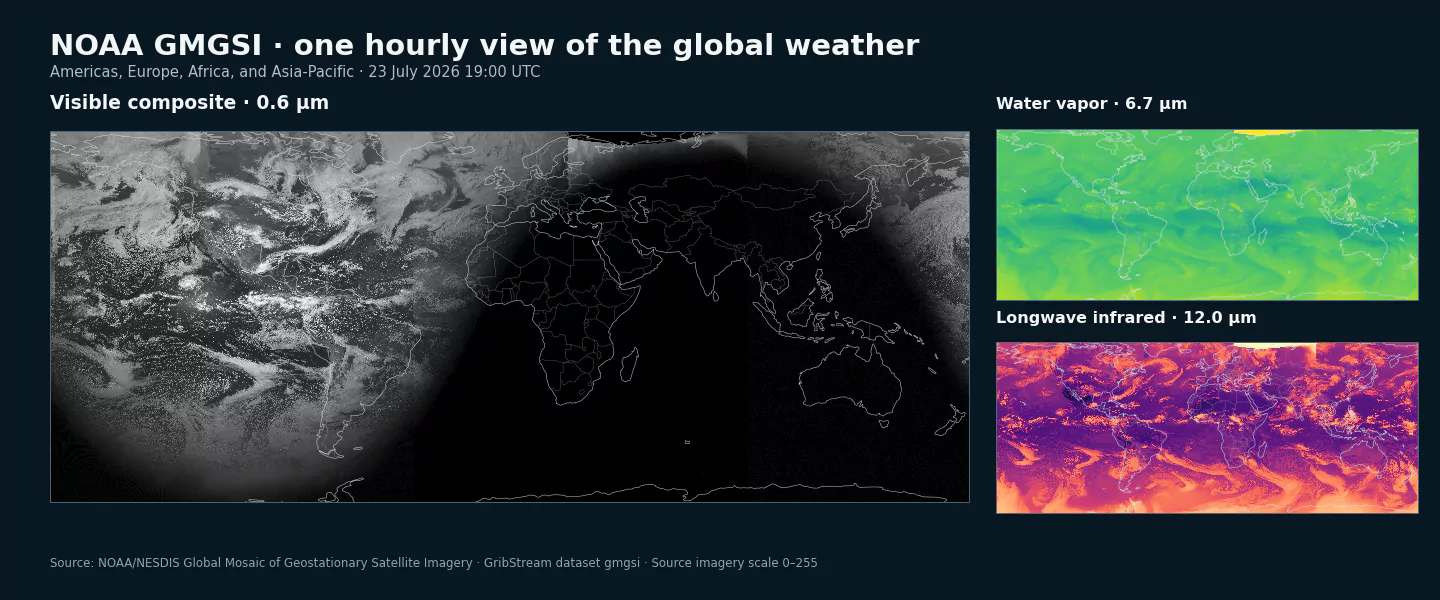
Four complementary views
GMGSI_VIS— visible, 0.6 µm: daylight cloud cover and texture, with contrast from land, water, snow, and ice.GMGSI_SIR— shortwave infrared, 3.8 µm: cloud cover and fog at night, together with cloud-surface contrast.GMGSI_WV— water vapor, 6.7 µm: moisture and dry-air patterns in the mid-to-upper troposphere, including broad circulation features.GMGSI_LIR— longwave infrared, 12.0 µm: continuous day-and-night cloud structure and broad land and sea temperature patterns.
The four fields share the same grid and nominal hourly timestamps. That makes it straightforward to compare cloud appearance across spectral channels or follow one weather system as it crosses from one satellite sector into another.
Why a world mosaic is useful
The individual GOES-19 GOES-East and GOES-18 GOES-West datasets retain much finer regional detail and many derived satellite products. GMGSI trades that local resolution and depth for geographic continuity.
That continuity matters for weather spanning large distances: tropical waves crossing ocean basins, large-scale moisture plumes, transoceanic aviation and marine operations, or a dashboard that needs the same imagery layer over New York, Montevideo, Paris, Lagos, Tokyo, and Perth. It is also a useful visual companion to global forecasts and atmospheric-composition datasets such as CAMS Global.
Interpreting the imagery
GMGSI is a composite, not a single instrument. NOAA combines imagery from GOES, Himawari, and Meteosat satellites. Differences in scan timing, viewing geometry, calibration, illumination, and cloud parallax can make seams or regional discontinuities visible where source sectors meet.
Values retain NOAA's common 0–255 source imagery scale. They support consistent rendering and relative pattern comparisons within each channel, but they are not reflectance percentages or brightness temperatures expressed in physical units. Values should not be compared numerically across different channels. Visible imagery is dark at night, while the infrared and water-vapor channels continue across the full day-night cycle.
The mosaic does not include the high polar regions. NOAA publishes one mosaic per hour, typically about two to three hours after observation; source outages or satellite operations can create gaps.
The GMGSI inventory lists all four exact selectors, wavelengths, and available dates.
Authoritative sources and related datasets:
- NOAA GMGSI product page: https://www.ospo.noaa.gov/products/imagery/gmgsi/
- NOAA composite imagery overview: https://www.ospo.noaa.gov/products/imagery/composite.html
- NOAA GMGSI Open Data registry: https://registry.opendata.aws/noaa-gmgsi/
- GOES-19 ABI GOES-East products
- GOES-18 ABI GOES-West products