
GribStream Blog
October nor’easter: a 9-knot wind forecast gap off Delmarva
HRRR predicts 29.4 knots off Delmarva while IFS gives 20.2. Native wind maps and 51 AIFS ensemble members reveal a persistent nor’easter forecast split.
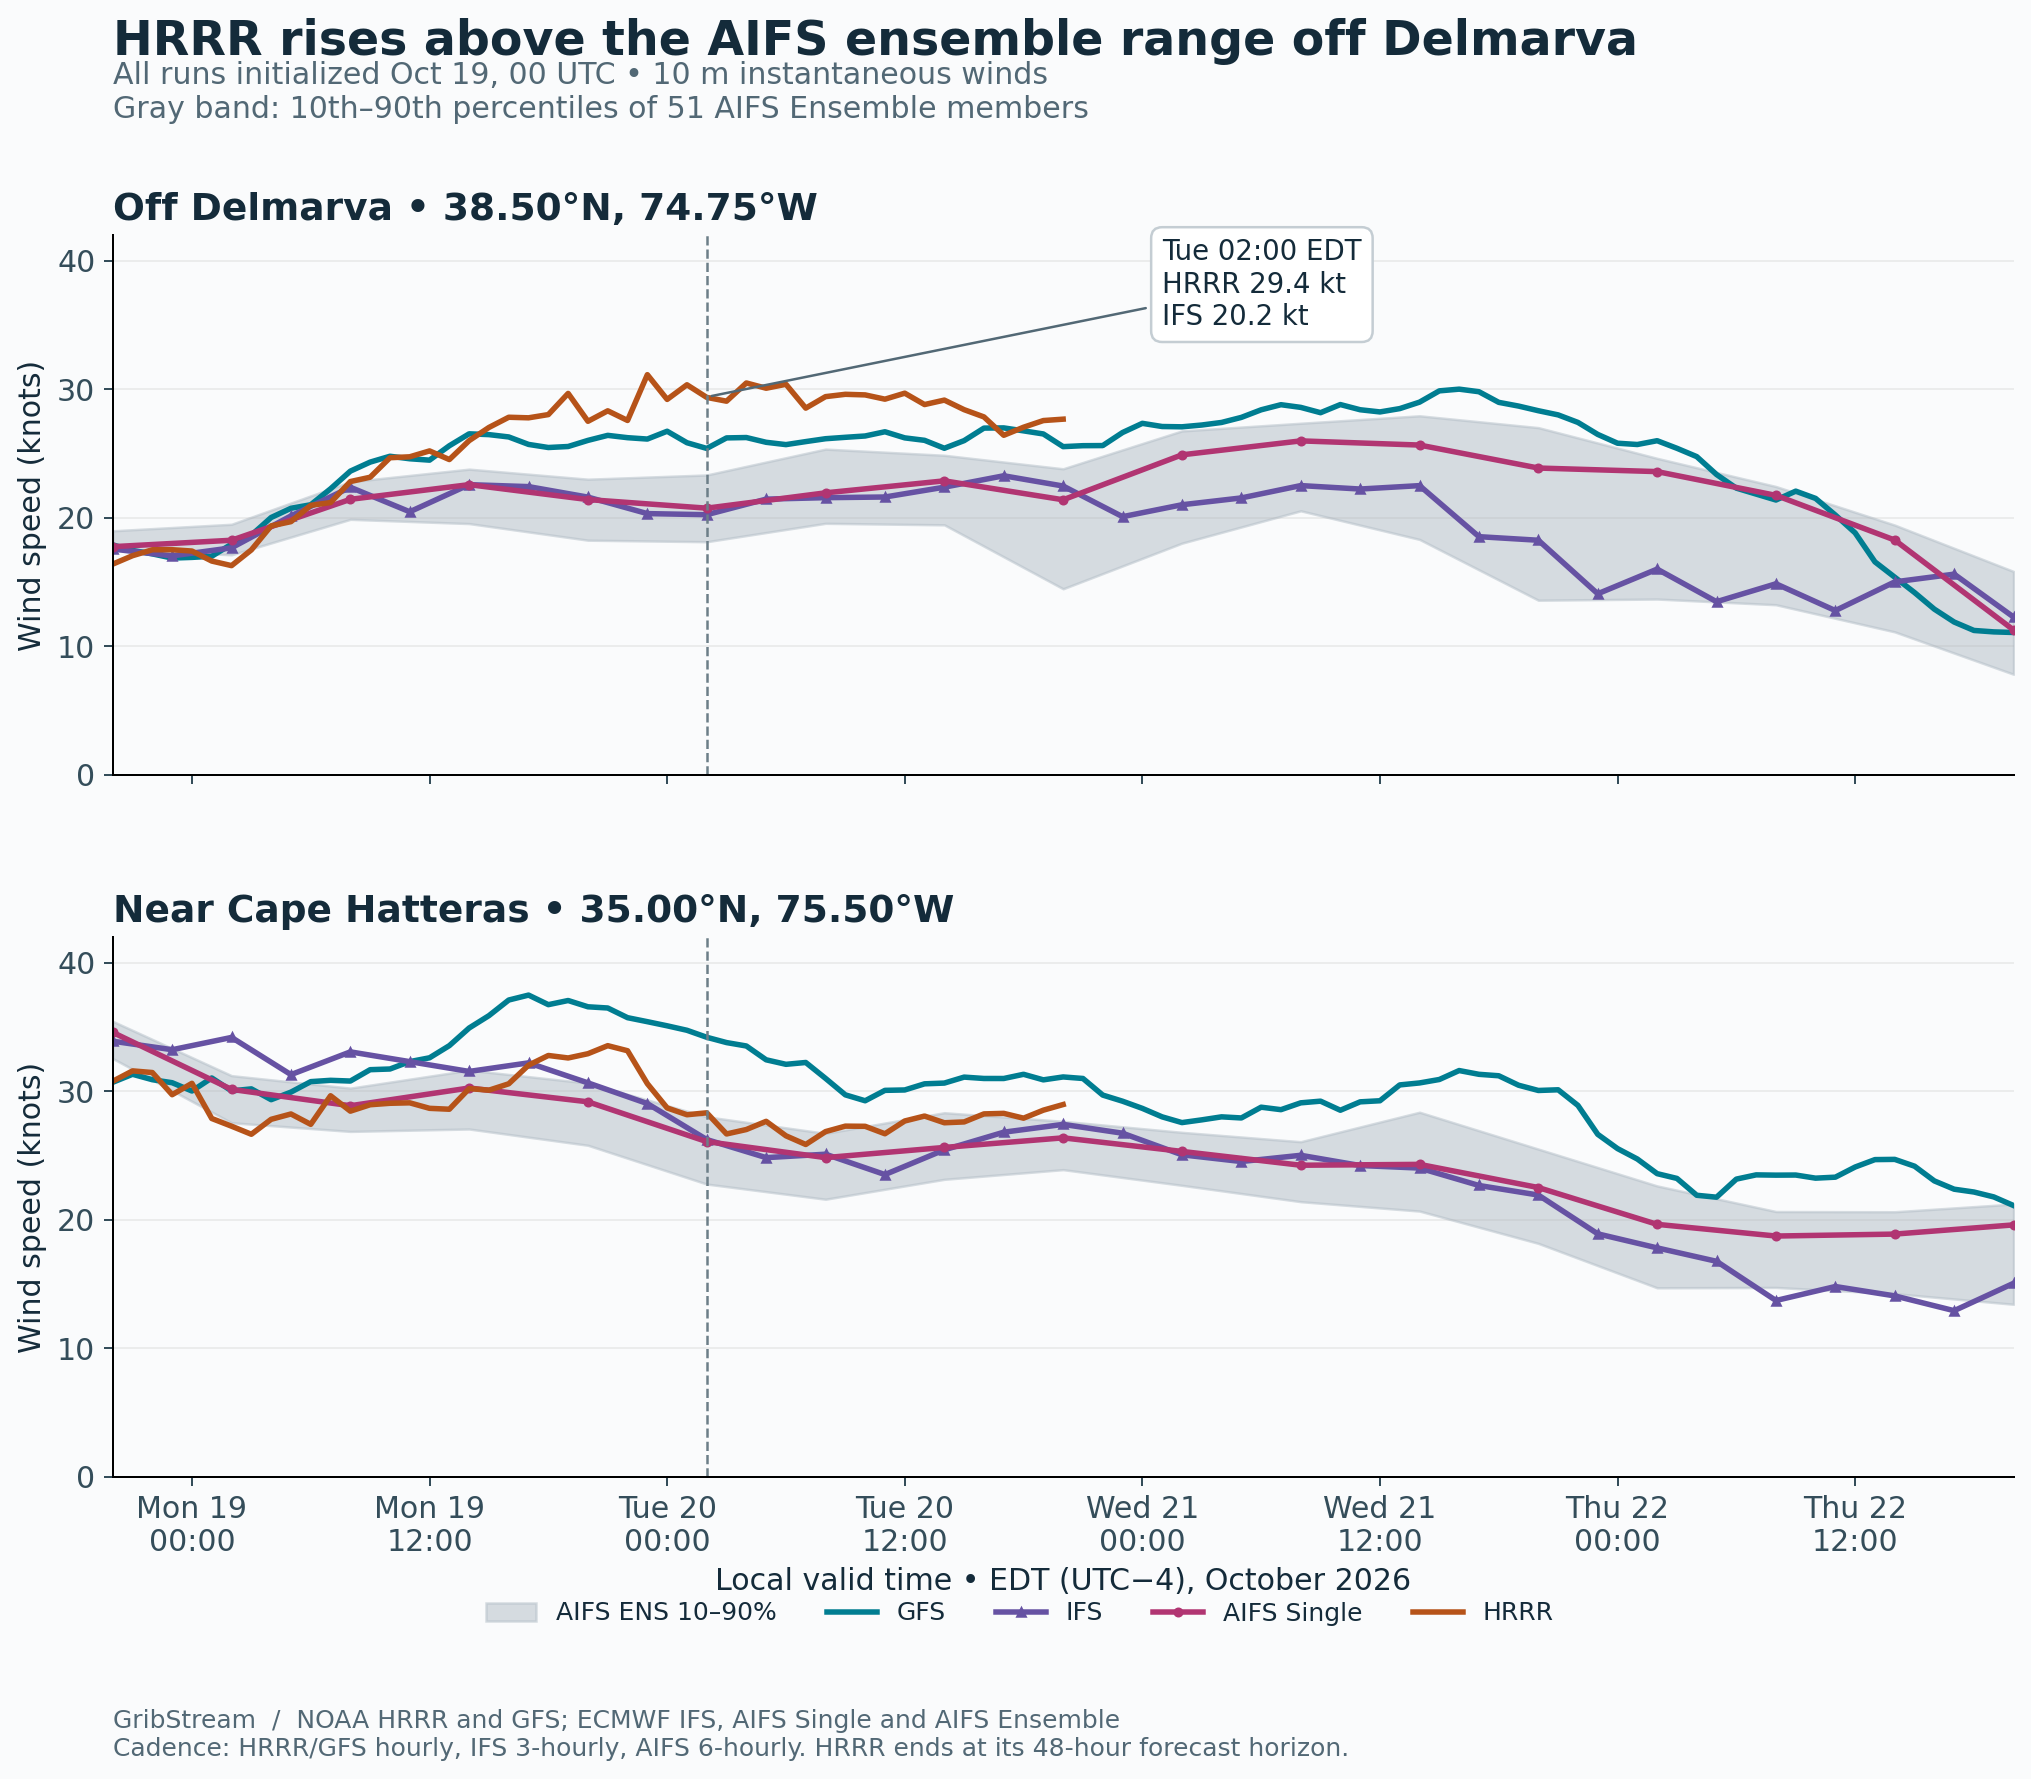
Off Delmarva, HRRR forecasts 29.4 knots at 02:00 EDT on Tuesday, October 20. IFS gives 20.2 knots. At the same location and hour, all 51 AIFS ensemble members sit below HRRR; their 10th–90th percentile range is 18.1–23.3 knots.
That separation lasts through a full day of the forecast. From Monday evening to Tuesday evening, HRRR stays between 26.4 and 31.1 knots at the offshore sample point. IFS ranges from 20.2 to 23.3 knots across its available outputs. GFS runs between them, around 25–27 knots.
The developing nor’easter is expected to keep marine and coastal conditions hazardous into midweek. In its October 19 forecast discussion, NWS Mount Holly describes persistent northeast winds, repeated elevated high tides and coastal flooding along New Jersey and Delaware. For an offshore operation with a 25-knot wind limit, the model choice changes whether Tuesday morning falls above or below that limit.
The stronger wind band extends north in HRRR and GFS
By 20:00 EDT on Monday, the models already separate off Delmarva: HRRR gives about 28 knots, GFS 26, IFS 22 and AIFS Single 21. Near Cape Hatteras, the four forecasts range from about 29 to 37 knots. The northern reach of the stronger coastal wind band creates the larger disagreement relative to the local wind speed.
Across the nearby offshore box—38.25–38.75°N, 75.00–74.50°W—the median wind is 28.0 knots in HRRR, 26.3 in GFS, 21.3 in IFS and 21.4 in AIFS Single at that Monday-evening hour. The difference extends across surrounding waters.
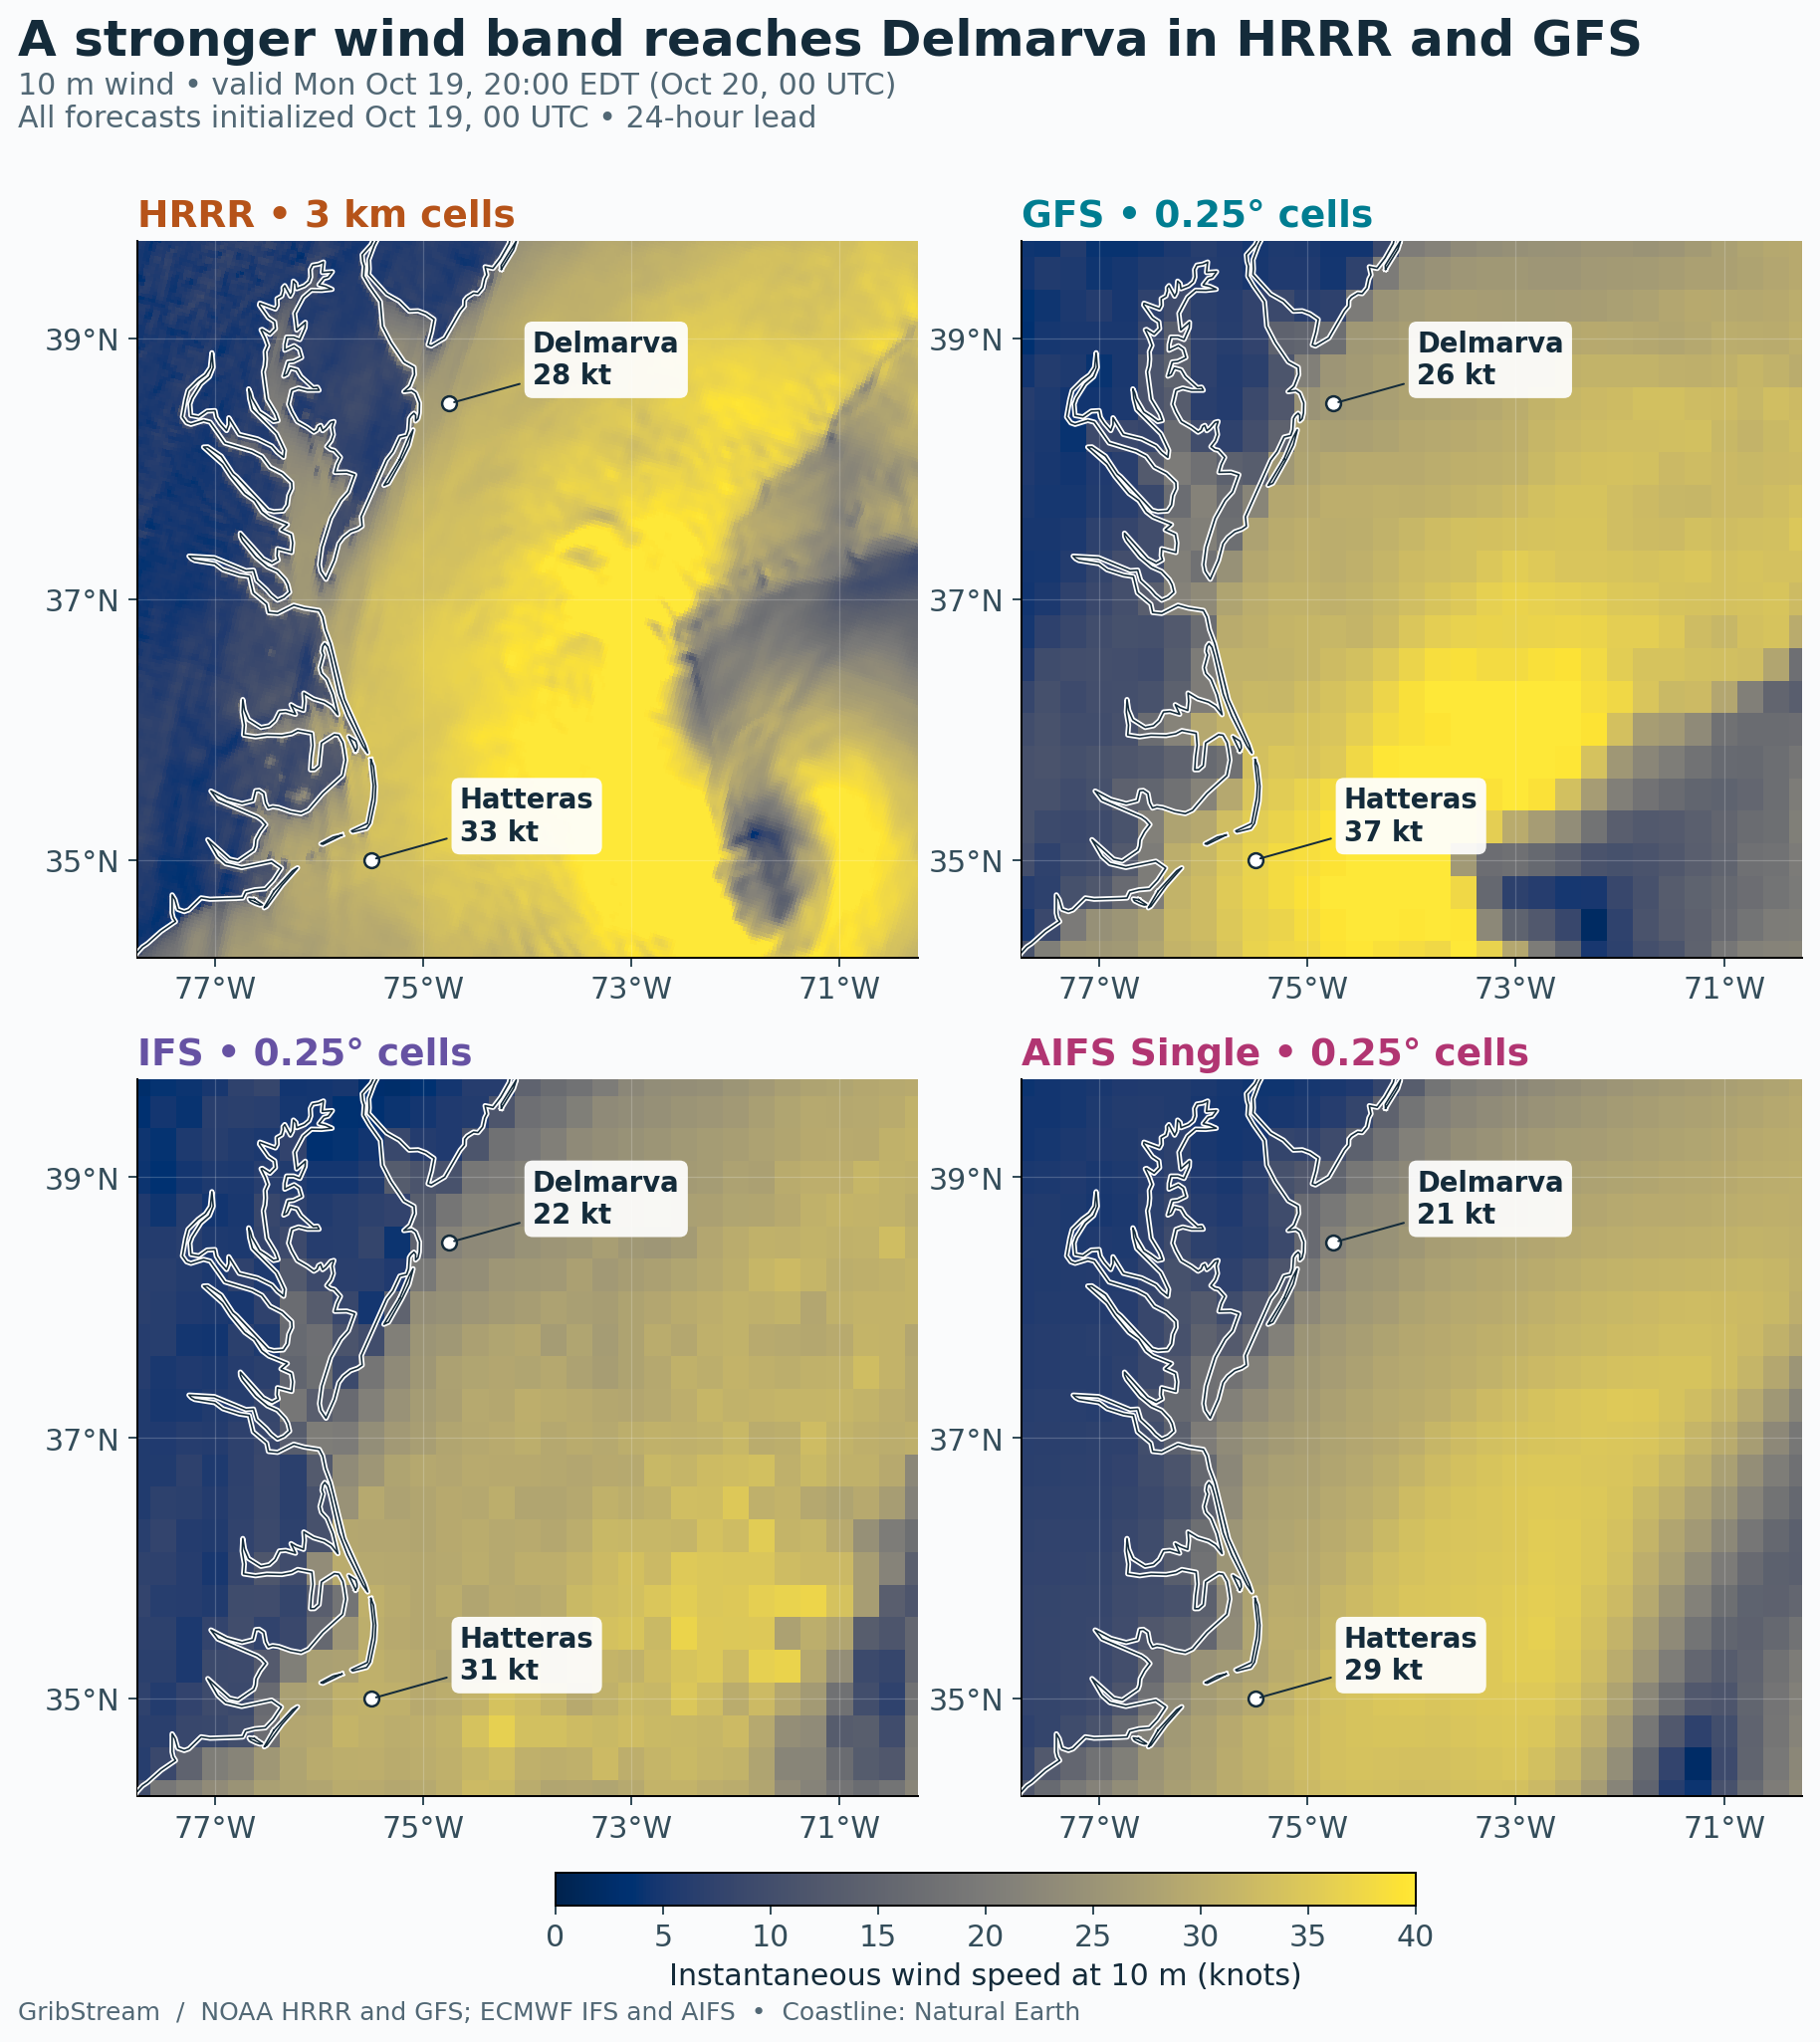
At Tuesday’s 02:00 EDT checkpoint, averaging 67 native HRRR cells across a 0.25° square centered on the Delmarva sample gives 30.2 knots. The individual point forecast is 29.4 knots. The stronger HRRR signal survives averaging over an area comparable to the global output spacing.
The pressure fields provide a clue to the GFS–IFS contrast. At Monday’s 20:00 EDT checkpoint, the GFS pressure minimum lies at 34.5°N, 72.0°W. The IFS minimum sits about 137 km farther east, at 34.5°N, 70.5°W. Their pressures differ by only 0.5 hPa: 1004.8 in GFS and 1004.3 in IFS. The farther-west GFS low provides a plausible explanation for part of its stronger coastal wind band.
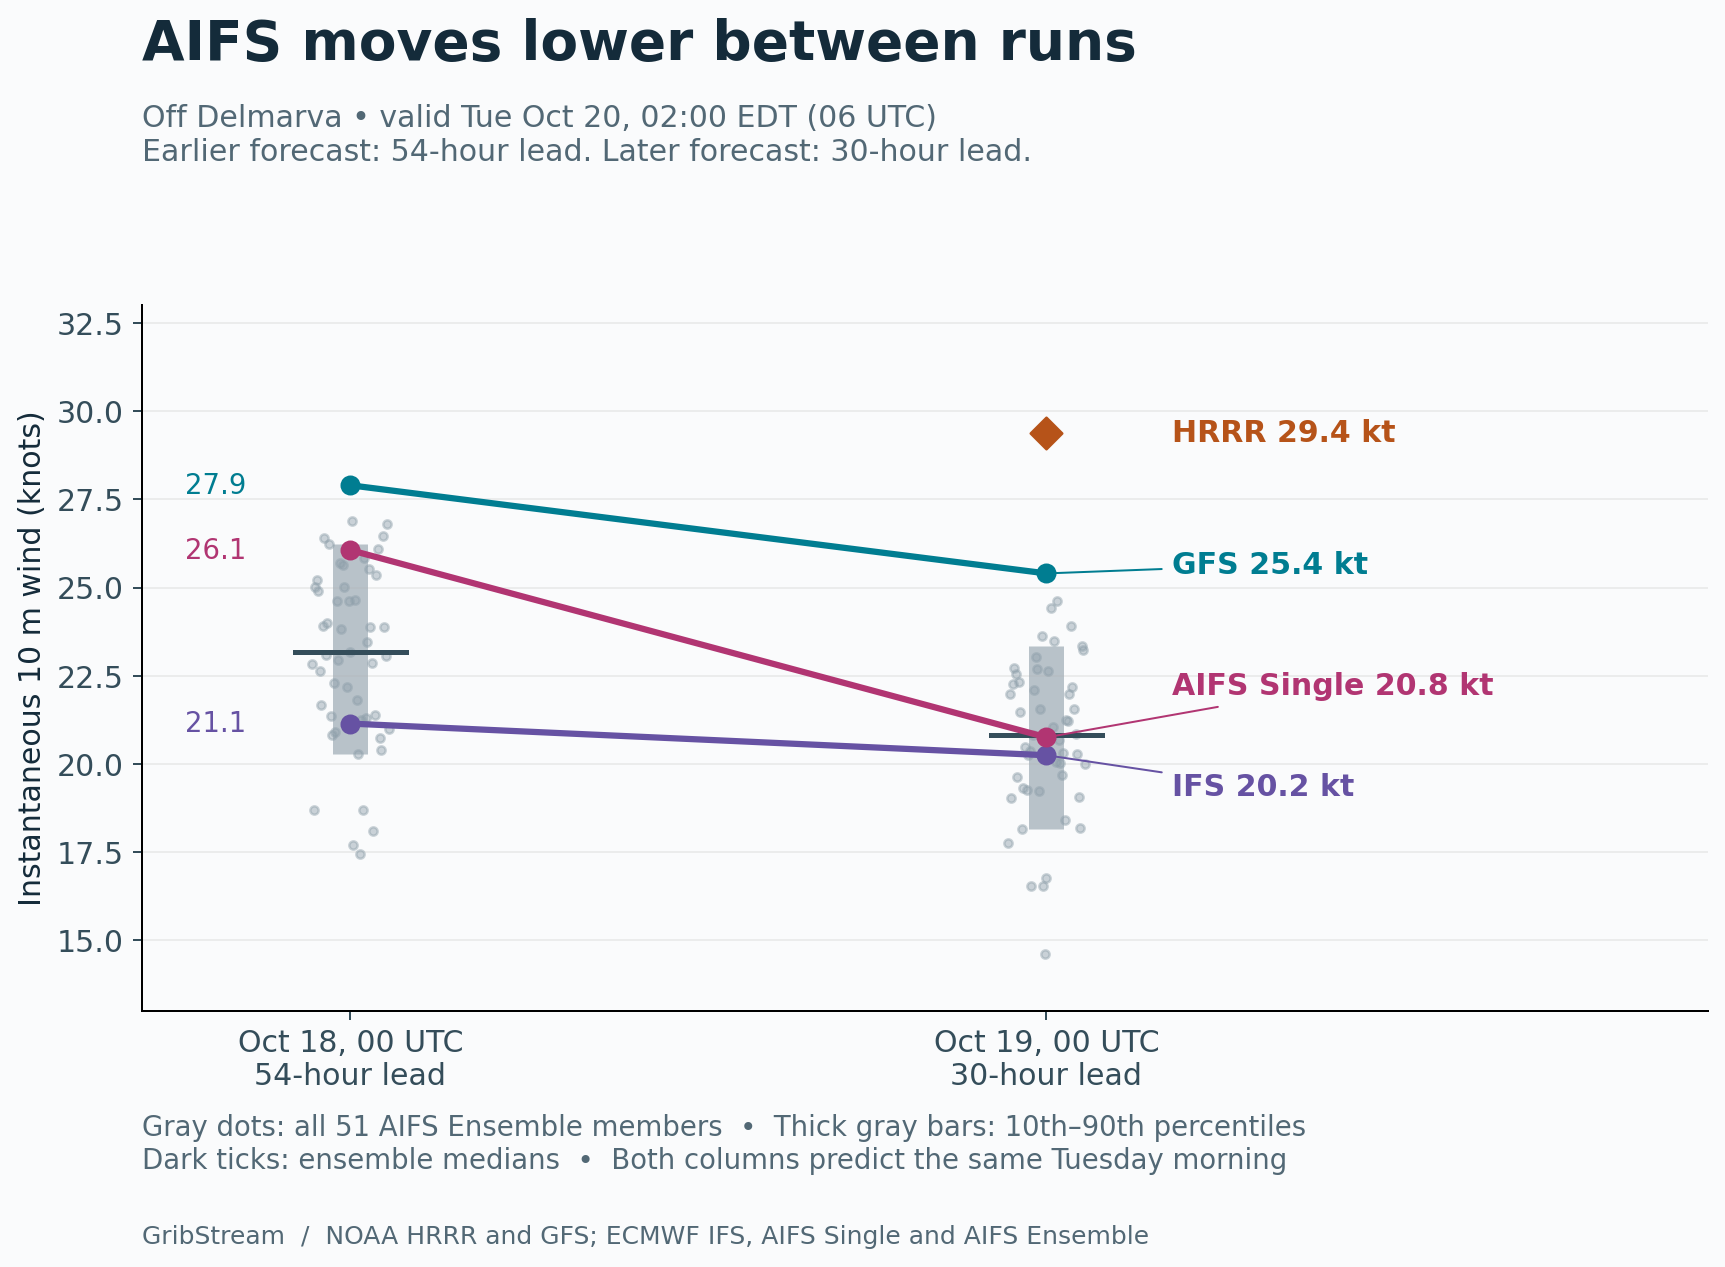
AIFS shifts lower as the storm approaches
For the same Tuesday-morning hour, AIFS Single falls from 26.1 to 20.8 knots between the October 18 and October 19, 00 UTC runs. The ensemble median also moves lower, from 23.2 to 20.8 knots, while its 90th percentile drops from 26.2 to 23.3 knots.
GFS eases from 27.9 to 25.4 knots. IFS changes from 21.1 to 20.2. The newer forecasts bring AIFS Single close to IFS, while HRRR remains above every member of the newer AIFS ensemble at this checkpoint.
NWS Mount Holly expects successive elevated high tides through Wednesday, with Wednesday evening’s cycle carrying the greatest concern in its October 19 discussion. Farther south, NWS Newport/Morehead City’s October 18 evening discussion describes a slow offshore low, blocking to its north and east, and substantial model spread in how long it lingers. The coastal exposure builds over several tide cycles, giving the duration and placement of the wind band practical importance alongside its peak speed.
Compare the HRRR, GFS, IFS, AIFS Single and AIFS Ensemble archives in GribStream for the locations and operating limits that matter to your work.
Data and calculation details
Wind speeds are instantaneous values at 10 m, calculated from horizontal components and converted to knots. The Delmarva sample is 38.50°N, 74.75°W; the Cape Hatteras sample is 35.00°N, 75.50°W. The main series covers 96 hours from October 19, 2026, 00 UTC, with HRRR covering its 48-hour horizon. GFS and HRRR outputs are hourly, IFS outputs are 3-hourly and AIFS outputs are 6-hourly. Ensemble quantiles use all 51 members at each valid time.
The maps use matching initialization, valid time and lead. HRRR cells are deduplicated by native coordinates and drawn on its 3 km grid. Offshore-box medians use 265 sampled HRRR cells and nine cells from each global product. The averaging check covers 38.375–38.625°N, 74.875–74.625°W. Pressure minima use native samples in the mapped region. Different coastal land masks and effective model resolutions influence local wind values.
These are forecasts for an active event. Ensemble percentiles are raw member distributions; their real-world coverage depends on calibration and shared model errors. Verification against appropriately exposed observations will establish which forecast best captured the wind band.