GribStream Code: cfsflxf
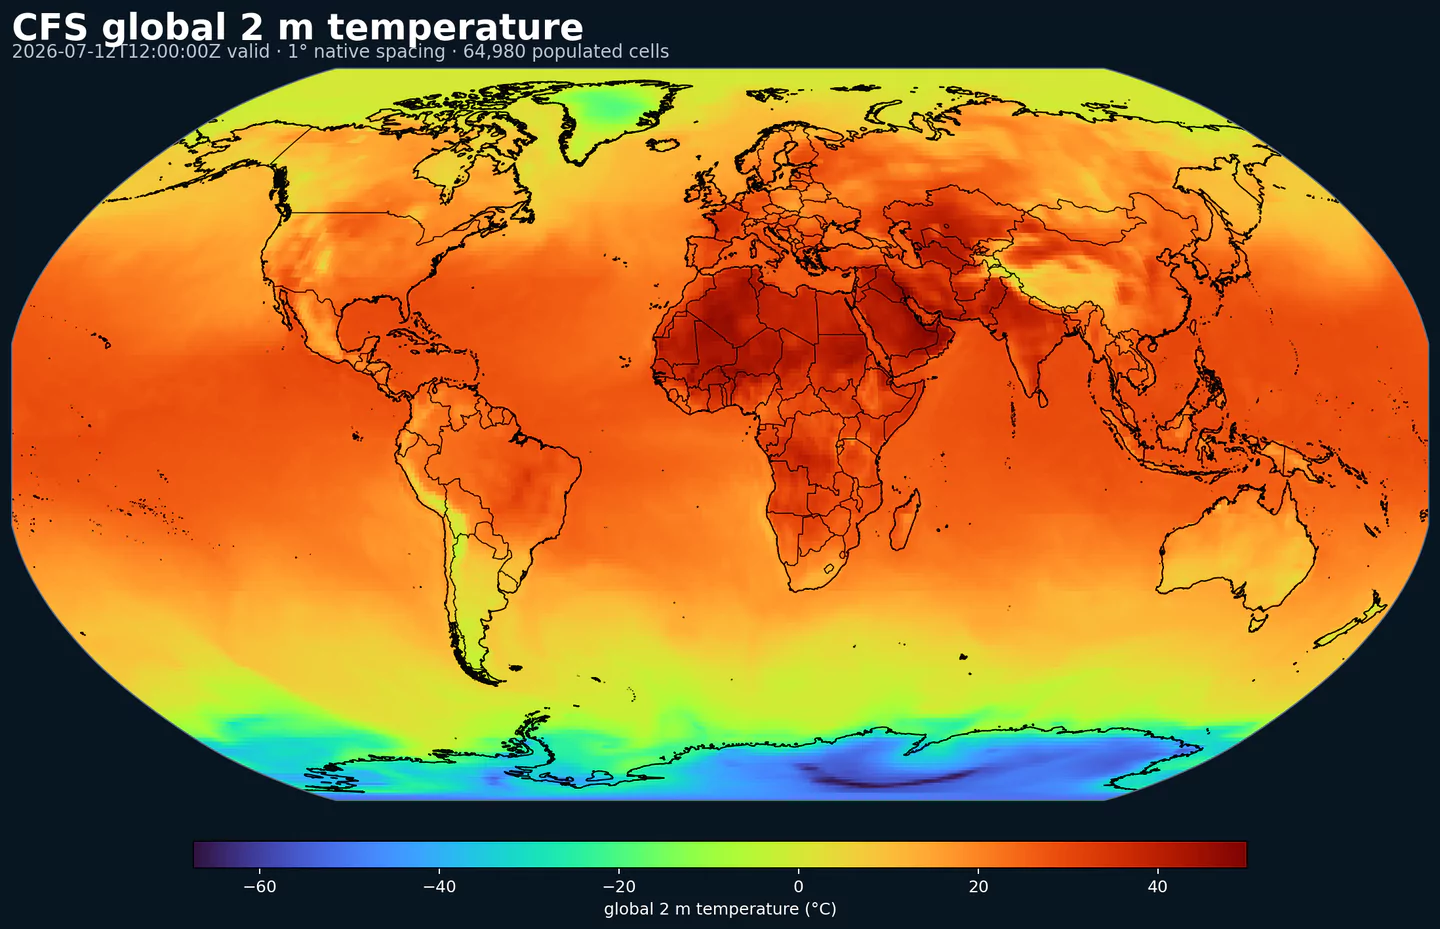
CFS 2 m temperature on the 1 degree global grid shared by this product family, with black country boundaries overlaid. This plot was generated from the cfsflxf dataset.
Description
CFS Radiative Fluxes is the energy-budget and land-surface product from NOAA/NCEP's Climate Forecast System. It focuses on radiative and surface fields rather than pressure-level atmosphere or ocean state.
The cfsflxf dataset includes shortwave and longwave radiation at the surface and top of atmosphere, plus related fields such as albedo, soil moisture, soil temperature, and vegetation cover when those variables are present in the source feed.
In GribStream, CFS Radiative Fluxes is useful when an application needs extended-range energy context: solar resource planning, surface heating, hydrology, land-atmosphere coupling, seasonal climate indicators, or input signals for forecast systems that consume CFS output.
Detail
Archive begins: 2018-10-31Product page: https://cfs.ncep.noaa.gov/cfsv2/docs.html Key Features:
Captures shortwave and longwave radiation fluxes used in climate, solar, and surface-energy applications.
Includes surface-related variables such as albedo, soil moisture, soil temperature, and vegetation cover when available.
Supports land-surface modeling, hydrology, solar planning, and global climate research.
Pairs with CFS pressure-level and ocean products when a workflow needs the coupled atmosphere-ocean-land system.
Resolution: 1.0° global grid.Temporal Coverage: Updated four times daily, with forecasts extending up to 5160 hours (~215 days).Primary Use Cases: radiation and energy flux studies, solar resource context, hydrology, land-surface interactions, seasonal climate signals, and extended-range inputs for forecasting or machine learning workflows.
Related datasets
CFS Pressure for atmospheric pressure levelsCFS Ocean for ocean and sea-ice fieldsGFS for operational global weather guidance
Parameters
Click a parameter to reveal variants in a compact table with ready-to-copy JSON selectors.
ACOND
– Aerodynamic Conductance (m/s)
1 variant
Aerodynamic conductance measures the efficiency of turbulent exchange of heat and moisture between the surface and atmosphere. It depends on wind speed, stability, and surface roughness and is used in surface energy balance and evapotranspiration calculations.
Units: m/s.
Higher values indicate stronger surface-atmosphere coupling and faster exchange.
Level
Info
Horizon
Introduced
Selector
surface0h-5160h
2018-10-31
{"name":"ACOND","level":"surface","info":""}
Copy
ALBDO
– Surface Albedo (percent)
1 variant
Surface albedo is the fraction of incoming shortwave radiation reflected by the surface. Higher albedo means less solar energy absorbed and a cooler surface.
Units: percent.
Important for snow and ice feedbacks and surface energy balance.
Level
Info
Horizon
Introduced
Selector
surface0h-5160h
2018-10-31
{"name":"ALBDO","level":"surface","info":""}
Copy
CDUVB
– Clear Sky UV-B Downward Solar Flux (W/m²)
1 variant
Clear‑sky UV‑B downward flux is UV‑B radiation at the surface without cloud effects. It is used for UV exposure estimates.
Level
Info
Horizon
Introduced
Selector
surface0h-5160h
2018-10-31
{"name":"CDUVB","level":"surface","info":""}
Copy
CNWAT
– Plant Canopy Surface Water (kg/m^2)
1 variant
Plant canopy surface water is liquid water intercepted by vegetation. It represents interception storage and evaporation potential.
Level
Info
Horizon
Introduced
Selector
surface0h-5160h
2018-10-31
{"name":"CNWAT","level":"surface","info":""}
Copy
CPRAT
– Convective Precipitation Rate (kg/m²/s)
1 variant
Convective precipitation rate is the intensity of precipitation produced by convection. It highlights storm‑driven rainfall rates.
Units: kg/m²/s.
Accumulations represent water-equivalent depth over the output interval; rates describe intensity.
Level
Info
Horizon
Introduced
Selector
surface0h-5160h
2018-10-31
{"name":"CPRAT","level":"surface","info":""}
Copy
CRAIN
– Categorical Rain (flag)
1 variant
Categorical indicator of rain occurrence at the surface during the output period. Useful as a yes/no mask for rain.
Units: flag.
Use with accumulation or rate fields for intensity.
Level
Info
Horizon
Introduced
Selector
surface0h-5160h
2018-10-31
{"name":"CRAIN","level":"surface","info":""}
Copy
CSDLF
– Clear Sky Downward Longwave Radiation Flux (W/m²)
1 variant
Downward longwave (thermal) flux represents incoming energy at the surface. Clear-sky versions remove cloud effects to isolate the atmospheric background.
Units: W/m².
Shortwave affects surface heating; longwave affects radiative cooling.
Level
Info
Horizon
Introduced
Selector
surface0h-5160h
2018-10-31
{"name":"CSDLF","level":"surface","info":""}
Copy
CSDSF
– Clear Sky Downward Shortwave Flux (W m-2)
1 variant
Clear‑sky downward shortwave flux is broadband solar energy at the surface without cloud effects.
Level
Info
Horizon
Introduced
Selector
surface0h-5160h
2018-10-31
{"name":"CSDSF","level":"surface","info":""}
Copy
CSULF
– Clear Sky Upward Longwave Radiation Flux (W/m²)
2 variants
Upward longwave (thermal) flux represents outgoing energy at the surface. Clear-sky versions remove cloud effects to isolate the atmospheric background.
Units: W/m².
Shortwave affects surface heating; longwave affects radiative cooling.
Level
Info
Horizon
Introduced
Selector
surface0h-5160h
2018-10-31
{"name":"CSULF","level":"surface","info":""}
Copy
top of atmosphere0h-5160h
2018-10-31
{"name":"CSULF","level":"top of atmosphere","info":""}
Copy
CSUSF
– Clear Sky Upward Solar Flux (W/m²)
2 variants
Upward shortwave (solar) flux represents outgoing energy at the surface. Clear-sky versions remove cloud effects to isolate the atmospheric background.
Level
Info
Horizon
Introduced
Selector
surface0h-5160h
2018-10-31
{"name":"CSUSF","level":"surface","info":""}
Copy
top of atmosphere0h-5160h
2018-10-31
{"name":"CSUSF","level":"top of atmosphere","info":""}
Copy
CWORK
– Cloud Work Function (J/kg)
1 variant
Cloud work function is an energy measure used by convection schemes to diagnose convective potential. Larger values generally indicate a more favorable environment for deep convection.
Units: J/kg.
Cloud fraction influences surface radiation and temperature.
Level
Info
Horizon
Introduced
Selector
entire atmosphere (considered as a single layer)0h-5160h
2018-10-31
{"name":"CWORK","level":"entire atmosphere (considered as a single layer)","info":""}
Copy
DLWRF
– Downward Longwave Radiation Flux (W/m^2)
1 variant
Downward longwave (thermal) flux represents incoming energy at the surface. It is a key driver of surface heating and cooling.
Units: W/m^2.
Shortwave affects surface heating; longwave affects radiative cooling.
Level
Info
Horizon
Introduced
Selector
surface0h-5160h
2018-10-31
{"name":"DLWRF","level":"surface","info":""}
Copy
DSWRF
– Downward Short-Wave Radiation Flux (W/m^2)
2 variants
Downward radiative flux represents incoming energy at the surface. It is a key driver of surface heating and cooling.
Units: W/m^2.
Shortwave affects surface heating; longwave affects radiative cooling.
Level
Info
Horizon
Introduced
Selector
surface0h-5160h
2018-10-31
{"name":"DSWRF","level":"surface","info":""}
Copy
top of atmosphere0h-5160h
2018-10-31
{"name":"DSWRF","level":"top of atmosphere","info":""}
Copy
DUVB
– UV-B Downward Solar Flux (W/m²)
1 variant
Downward UV‑B solar flux is the UV‑B portion of incoming sunlight at the surface. It is used for UV exposure and health guidance.
Level
Info
Horizon
Introduced
Selector
surface0h-5160h
2018-10-31
{"name":"DUVB","level":"surface","info":""}
Copy
EVBS
– Direct Evaporation from Bare Soil (W/m^2)
1 variant
Direct evaporation from bare soil is the latent heat flux associated with moisture evaporating from exposed soil surfaces.
Units: W/m^2.
Soil state affects evapotranspiration and boundary-layer moisture.
Level
Info
Horizon
Introduced
Selector
surface0h-5160h
2018-10-31
{"name":"EVBS","level":"surface","info":""}
Copy
EVCW
– Evaporation from Canopy Interception (kg/m²)
1 variant
Canopy evaporation represents water stored on vegetation surfaces that evaporates back to the atmosphere. It affects rainfall interception losses.
Level
Info
Horizon
Introduced
Selector
surface0h-5160h
2018-10-31
{"name":"EVCW","level":"surface","info":""}
Copy
FRICV
– Frictional Velocity (m/s)
1 variant
Friction velocity (u*) is a measure of near‑surface shear stress. It is commonly used in turbulence, dust, and air‑sea exchange calculations.
Level
Info
Horizon
Introduced
Selector
surface0h-5160h
2018-10-31
{"name":"FRICV","level":"surface","info":""}
Copy
GFLUX
– Ground Heat Flux (W/m^2)
1 variant
Ground heat flux is the conductive heat exchange between the surface and the subsurface. It is a key term in the surface energy balance.
Level
Info
Horizon
Introduced
Selector
surface0h-5160h
2018-10-31
{"name":"GFLUX","level":"surface","info":""}
Copy
HGT
– Geopotential Height (gpm)
2 variants
Geopotential height is the altitude of a pressure surface in the atmosphere. It is the primary field for identifying ridges, troughs, and large‑scale flow patterns.
Level
Info
Horizon
Introduced
Selector
1 hybrid level0h-5160h
2018-10-31
{"name":"HGT","level":"1 hybrid level","info":""}
Copy
surface0h-5160h
2018-10-31
{"name":"HGT","level":"surface","info":""}
Copy
HPBL
– Planetary Boundary Layer Height (m)
1 variant
Boundary layer height marks the depth of the turbulent surface-influenced layer. It affects mixing, dispersion, and surface fluxes.
Level
Info
Horizon
Introduced
Selector
surface0h-5160h
2018-10-31
{"name":"HPBL","level":"surface","info":""}
Copy
ICEC
– Ice Cover (Proportion)
1 variant
Ice cover is the proportion of the grid cell covered by ice. It is used as a surface-state mask for sea ice and related cryosphere diagnostics.
Level
Info
Horizon
Introduced
Selector
surface0h-5160h
2018-10-31
{"name":"ICEC","level":"surface","info":""}
Copy
ICETK
– Ice Thickness (m)
1 variant
Ice thickness is the physical thickness of sea or lake ice. It is important for marine navigation and heat exchange.
Level
Info
Horizon
Introduced
Selector
surface0h-5160h
2018-10-31
{"name":"ICETK","level":"surface","info":""}
Copy
LAND
– Land Cover (0=sea, 1=land) (Proportion)
1 variant
Land cover is a land/sea mask where 0 indicates sea and 1 indicates land. It is used to separate land and ocean surface processes.
Level
Info
Horizon
Introduced
Selector
surface0h-5160h
2018-10-31
{"name":"LAND","level":"surface","info":""}
Copy
LHTFL
– Latent Heat Net Flux (W/m^2)
1 variant
Latent heat net flux represents energy exchange due to evaporation/condensation at the surface. It links moisture and energy budgets.
Level
Info
Horizon
Introduced
Selector
surface0h-5160h
2018-10-31
{"name":"LHTFL","level":"surface","info":""}
Copy
NBDSF
– Near-Infrared Beam Downward Solar Flux (W/m²)
1 variant
Near‑infrared beam downward solar flux is the direct (beam) NIR component reaching the surface. It represents unscattered sunlight.
Level
Info
Horizon
Introduced
Selector
surface0h-5160h
2018-10-31
{"name":"NBDSF","level":"surface","info":""}
Copy
NDDSF
– Near-Infrared Diffuse Downward Solar Flux (W/m²)
1 variant
Near‑infrared diffuse downward solar flux is the scattered NIR component reaching the surface. It dominates under hazy or cloudy skies.
Level
Info
Horizon
Introduced
Selector
surface0h-5160h
2018-10-31
{"name":"NDDSF","level":"surface","info":""}
Copy
PEVPR
– Potential Evaporation Rate (W/m^2)
1 variant
Potential evaporation rate is the potential latent heat flux for evaporation under an assumed unlimited water supply.
Level
Info
Horizon
Introduced
Selector
surface0h-5160h
2018-10-31
{"name":"PEVPR","level":"surface","info":""}
Copy
PRATE
– Precipitation Rate (kg/(m^2 s))
1 variant
Precipitation rate is the total intensity of precipitation over the period. It combines convective and stratiform contributions.
Units: kg/(m^2 s).
Accumulations represent water-equivalent depth over the output interval; rates describe intensity.
Level
Info
Horizon
Introduced
Selector
surface0h-5160h
2018-10-31
{"name":"PRATE","level":"surface","info":""}
Copy
PRES
– Pressure (Pa)
9 variants
Pressure is the atmospheric pressure at the specified level. It is a fundamental mass-field variable for dynamics and thermodynamics.
Level
Info
Horizon
Introduced
Selector
convective cloud bottom level6h-5160h
2018-10-31
{"name":"PRES","level":"convective cloud bottom level","info":""}
Copy
convective cloud top level6h-5160h
2018-10-31
{"name":"PRES","level":"convective cloud top level","info":""}
Copy
high cloud bottom level0h-5160h
2018-10-31
{"name":"PRES","level":"high cloud bottom level","info":""}
Copy
high cloud top level0h-5160h
2018-10-31
{"name":"PRES","level":"high cloud top level","info":""}
Copy
low cloud bottom level0h-5160h
2018-10-31
{"name":"PRES","level":"low cloud bottom level","info":""}
Copy
low cloud top level0h-5160h
2018-10-31
{"name":"PRES","level":"low cloud top level","info":""}
Copy
middle cloud bottom level0h-5160h
2018-10-31
{"name":"PRES","level":"middle cloud bottom level","info":""}
Copy
middle cloud top level0h-5160h
2018-10-31
{"name":"PRES","level":"middle cloud top level","info":""}
Copy
surface0h-5160h
2018-10-31
{"name":"PRES","level":"surface","info":""}
Copy
PWAT
– Precipitable Water (kg/m^2)
1 variant
Precipitable water is the total column water vapor from the surface to the top of the atmosphere. It is a key moisture indicator.
Level
Info
Horizon
Introduced
Selector
entire atmosphere (considered as a single layer)0h-5160h
2018-10-31
{"name":"PWAT","level":"entire atmosphere (considered as a single layer)","info":""}
Copy
QMAX
– Maximum Specific Humidity (kg/kg)
1 variant
Maximum specific humidity is the peak water‑vapor mixing ratio during the period. It highlights the moistest conditions.
Units: kg/kg.
Higher values indicate more atmospheric moisture and greater cloud or precip potential.
Level
Info
Horizon
Introduced
Selector
2 m above ground0h-5160h
2018-10-31
{"name":"QMAX","level":"2 m above ground","info":""}
Copy
QMIN
– Minimum Specific Humidity (kg/kg)
1 variant
Minimum specific humidity is the lowest water‑vapor mixing ratio during the period. It highlights the driest conditions.
Units: kg/kg.
Higher values indicate more atmospheric moisture and greater cloud or precip potential.
Level
Info
Horizon
Introduced
Selector
2 m above ground0h-5160h
2018-10-31
{"name":"QMIN","level":"2 m above ground","info":""}
Copy
SBSNO
– Sublimation (Snow Cover) (kg/m²)
1 variant
Snow sublimation is the loss of snow directly to water vapor. It reduces snowpack without melting and can be important in dry, windy conditions.
Units: kg/m².
Accumulations represent water-equivalent depth over the output interval; rates describe intensity.
Level
Info
Horizon
Introduced
Selector
surface0h-5160h
2018-10-31
{"name":"SBSNO","level":"surface","info":""}
Copy
SFCR
– Surface Roughness (m)
1 variant
Surface roughness length is the effective height of surface obstacles that control drag. It strongly influences near-surface wind, turbulence, and exchange fluxes.
Level
Info
Horizon
Introduced
Selector
surface0h-5160h
2018-10-31
{"name":"SFCR","level":"surface","info":""}
Copy
SFEXC
– Exchange Coefficient at Surface (dimensionless)
1 variant
Surface exchange coefficient is the bulk transfer coefficient used to compute turbulent heat and moisture fluxes. It depends on stability and roughness.
Level
Info
Horizon
Introduced
Selector
surface0h-5160h
2018-10-31
{"name":"SFEXC","level":"surface","info":""}
Copy
SHTFL
– Sensible Heat Net Flux (W/m^2)
1 variant
Sensible heat net flux is turbulent heat exchange driven by temperature differences. It affects near‑surface temperature and stability.
Level
Info
Horizon
Introduced
Selector
surface0h-5160h
2018-10-31
{"name":"SHTFL","level":"surface","info":""}
Copy
SLTYP
– Surface Slope Type (Index)
1 variant
Surface slope type is the land-surface slope classification used by the model for runoff and drainage behavior.
Units: Index.
Soil state affects evapotranspiration and boundary-layer moisture.
Level
Info
Horizon
Introduced
Selector
surface0h-5160h
2018-10-31
{"name":"SLTYP","level":"surface","info":""}
Copy
SNOD
– Snow Depth (m)
1 variant
Snow depth is the physical thickness of the snowpack. It is distinct from snow water equivalent, which measures water content.
Level
Info
Horizon
Introduced
Selector
surface0h-5160h
2018-10-31
{"name":"SNOD","level":"surface","info":""}
Copy
SNOHF
– Snow Phase Change Heat Flux (W m-2)
1 variant
Snow phase change heat flux is the energy used for melting or freezing snow. It links radiation and snowpack evolution.
Units: W m-2.
Accumulations represent water-equivalent depth over the output interval; rates describe intensity.
Level
Info
Horizon
Introduced
Selector
surface0h-5160h
2018-10-31
{"name":"SNOHF","level":"surface","info":""}
Copy
SNOWC
– Snow Cover (percent)
1 variant
Snow cover is the fraction of the grid cell covered by snow. It helps interpret albedo, runoff timing, and surface energy balance.
Level
Info
Horizon
Introduced
Selector
surface0h-5160h
2018-10-31
{"name":"SNOWC","level":"surface","info":""}
Copy
SOILL
– Liquid Volumetric Soil Moisture (non-frozen) (Proportion)
4 variants
Liquid volumetric soil moisture (non-frozen) is the liquid portion of soil water expressed as a proportion of soil volume, excluding soil ice.
Units: Proportion.
Soil state affects evapotranspiration and boundary-layer moisture.
Level
Info
Horizon
Introduced
Selector
0-0.1 m below ground0h-5160h
2018-10-31
{"name":"SOILL","level":"0-0.1 m below ground","info":""}
Copy
0.1-0.4 m below ground0h-5160h
2018-10-31
{"name":"SOILL","level":"0.1-0.4 m below ground","info":""}
Copy
0.4-1 m below ground0h-5160h
2018-10-31
{"name":"SOILL","level":"0.4-1 m below ground","info":""}
Copy
1-2 m below ground0h-5160h
2018-10-31
{"name":"SOILL","level":"1-2 m below ground","info":""}
Copy
SOILM
– Soil Moisture Content (kg/m^2)
1 variant
Soil moisture content is the amount of water stored in the soil layer or column represented by the product.
Units: kg/m^2.
Soil state affects evapotranspiration and boundary-layer moisture.
Level
Info
Horizon
Introduced
Selector
0-2 m below ground0h-5160h
2018-10-31
{"name":"SOILM","level":"0-2 m below ground","info":""}
Copy
SOILW
– Volumetric Soil Moisture Content (Fraction)
4 variants
Volumetric soil moisture is the fraction of soil volume occupied by water. It is commonly used in hydrology and drought monitoring.
Units: Fraction.
Soil state affects evapotranspiration and boundary-layer moisture.
Level
Info
Horizon
Introduced
Selector
0-0.1 m below ground0h-5160h
2018-10-31
{"name":"SOILW","level":"0-0.1 m below ground","info":""}
Copy
0.1-0.4 m below ground0h-5160h
2018-10-31
{"name":"SOILW","level":"0.1-0.4 m below ground","info":""}
Copy
0.4-1 m below ground0h-5160h
2018-10-31
{"name":"SOILW","level":"0.4-1 m below ground","info":""}
Copy
1-2 m below ground0h-5160h
2018-10-31
{"name":"SOILW","level":"1-2 m below ground","info":""}
Copy
SOTYP
– Soil Type (code)
1 variant
Soil type class used by the land-surface model. It controls infiltration, drainage, and heat/moisture storage, and strongly affects runoff and evapotranspiration.
0
Reserved
1
Sand
2
Loamy sand
3
Sandy loam
4
Silt loam
5
Organic
6
Sandy clay loam
7
Silty clay loam
8
Clay loam
9
Sandy clay
10
Silty clay
11
Clay
12-191
Reserved
192-254
Reserved for local use
255
Missing
Level
Info
Horizon
Introduced
Selector
surface0h-5160h
2018-10-31
{"name":"SOTYP","level":"surface","info":""}
Copy
SPFH
– Specific Humidity (kg/kg)
2 variants
Specific humidity is the mass of water vapor per mass of air at the specified level. It is central to moisture transport.
Units: kg/kg.
Higher values indicate more atmospheric moisture and greater cloud or precip potential.
Level
Info
Horizon
Introduced
Selector
1 hybrid level0h-5160h
2018-10-31
{"name":"SPFH","level":"1 hybrid level","info":""}
Copy
2 m above ground0h-5160h
2018-10-31
{"name":"SPFH","level":"2 m above ground","info":""}
Copy
SRWEQ
– Snowfall Water Equivalent (kg/m²)
1 variant
Snowfall water equivalent is the liquid water content of new snowfall during the period. It is used for snow totals and hydrology.
Units: kg/m².
Accumulations represent water-equivalent depth over the output interval; rates describe intensity.
Level
Info
Horizon
Introduced
Selector
surface0h-5160h
2018-10-31
{"name":"SRWEQ","level":"surface","info":""}
Copy
SSRUN
– Storm Surface Runoff (kg/m^2)
1 variant
Storm surface runoff represents overland flow generated by rainfall or snowmelt. It responds quickly to heavy precipitation.
Level
Info
Horizon
Introduced
Selector
surface0h-5160h
2018-10-31
{"name":"SSRUN","level":"surface","info":""}
Copy
TCDC
– Total Cloud Cover (percent)
6 variants
Total cloud cover is the fraction of the grid cell covered by clouds at any level. It influences radiation, temperature, and visibility.
Units: percent.
Cloud fraction influences surface radiation and temperature.
Level
Info
Horizon
Introduced
Selector
boundary layer cloud layer0h-5160h
2018-10-31
{"name":"TCDC","level":"boundary layer cloud layer","info":""}
Copy
convective cloud layer0h-5160h
2018-10-31
{"name":"TCDC","level":"convective cloud layer","info":""}
Copy
entire atmosphere (considered as a single layer)0h-5160h
2018-10-31
{"name":"TCDC","level":"entire atmosphere (considered as a single layer)","info":""}
Copy
high cloud layer0h-5160h
2018-10-31
{"name":"TCDC","level":"high cloud layer","info":""}
Copy
low cloud layer0h-5160h
2018-10-31
{"name":"TCDC","level":"low cloud layer","info":""}
Copy
middle cloud layer0h-5160h
2018-10-31
{"name":"TCDC","level":"middle cloud layer","info":""}
Copy
TMAX
– Maximum Temperature (K)
1 variant
Maximum temperature is the highest temperature reached during the output period. It is commonly used for heat stress and daily extremes.
Level
Info
Horizon
Introduced
Selector
2 m above ground0h-5160h
2018-10-31
{"name":"TMAX","level":"2 m above ground","info":""}
Copy
TMIN
– Minimum Temperature (K)
1 variant
Minimum temperature is the lowest temperature reached during the output period. It is commonly used for frost and cold-stress assessment.
Level
Info
Horizon
Introduced
Selector
2 m above ground0h-5160h
2018-10-31
{"name":"TMIN","level":"2 m above ground","info":""}
Copy
TMP
– Temperature (K)
10 variants
Air temperature is the thermal state of the atmosphere at the specified level. It influences density, stability, and energy exchange.
Level
Info
Horizon
Introduced
Selector
0-0.1 m below ground0h-5160h
2018-10-31
{"name":"TMP","level":"0-0.1 m below ground","info":""}
Copy
0.1-0.4 m below ground0h-5160h
2018-10-31
{"name":"TMP","level":"0.1-0.4 m below ground","info":""}
Copy
0.4-1 m below ground0h-5160h
2018-10-31
{"name":"TMP","level":"0.4-1 m below ground","info":""}
Copy
1 hybrid level0h-5160h
2018-10-31
{"name":"TMP","level":"1 hybrid level","info":""}
Copy
1-2 m below ground0h-5160h
2018-10-31
{"name":"TMP","level":"1-2 m below ground","info":""}
Copy
2 m above ground0h-5160h
2018-10-31
{"name":"TMP","level":"2 m above ground","info":""}
Copy
high cloud top level0h-5160h
2018-10-31
{"name":"TMP","level":"high cloud top level","info":""}
Copy
low cloud top level0h-5160h
2018-10-31
{"name":"TMP","level":"low cloud top level","info":""}
Copy
middle cloud top level0h-5160h
2018-10-31
{"name":"TMP","level":"middle cloud top level","info":""}
Copy
surface0h-5160h
2018-10-31
{"name":"TMP","level":"surface","info":""}
Copy
TRANS
– Transpiration Rate (kg/m²/s)
1 variant
Transpiration rate is the flux of water vapor from vegetation to the atmosphere. It links plant activity to surface energy balance and humidity.
Level
Info
Horizon
Introduced
Selector
surface0h-5160h
2018-10-31
{"name":"TRANS","level":"surface","info":""}
Copy
U-GWD
– Zonal Gravity Wave Stress (N/m²)
1 variant
Zonal gravity wave stress is the east-west component of momentum flux from unresolved gravity waves. It affects large-scale circulation and jet dynamics.
Level
Info
Horizon
Introduced
Selector
surface0h-5160h
2018-10-31
{"name":"U-GWD","level":"surface","info":""}
Copy
UFLX
– Momentum Flux, U Component (N/m²)
1 variant
Momentum flux, u‑component is the east‑west surface stress exerted by the atmosphere. It drives boundary-layer dynamics.
Level
Info
Horizon
Introduced
Selector
surface0h-5160h
2018-10-31
{"name":"UFLX","level":"surface","info":""}
Copy
UGRD
– U-Component of Wind (m/s)
2 variants
U‑component of wind is the east‑west component of the horizontal wind. Combine with v for speed and direction.
Units: m/s.
Combine u and v components to compute speed and direction.
Level
Info
Horizon
Introduced
Selector
1 hybrid level0h-5160h
2018-10-31
{"name":"UGRD","level":"1 hybrid level","info":""}
Copy
10 m above ground0h-5160h
2018-10-31
{"name":"UGRD","level":"10 m above ground","info":""}
Copy
ULWRF
– Upward Longwave Radiation Flux (W/m^2)
2 variants
Upward longwave (thermal) flux represents outgoing energy at the surface. It is a key driver of surface heating and cooling.
Units: W/m^2.
Shortwave affects surface heating; longwave affects radiative cooling.
Level
Info
Horizon
Introduced
Selector
surface0h-5160h
2018-10-31
{"name":"ULWRF","level":"surface","info":""}
Copy
top of atmosphere0h-5160h
2018-10-31
{"name":"ULWRF","level":"top of atmosphere","info":""}
Copy
USWRF
– Upward Short-Wave Radiation Flux (W/m^2)
2 variants
Upward radiative flux represents outgoing energy at the surface. It is a key driver of surface heating and cooling.
Units: W/m^2.
Shortwave affects surface heating; longwave affects radiative cooling.
Level
Info
Horizon
Introduced
Selector
surface0h-5160h
2018-10-31
{"name":"USWRF","level":"surface","info":""}
Copy
top of atmosphere0h-5160h
2018-10-31
{"name":"USWRF","level":"top of atmosphere","info":""}
Copy
V-GWD
– Meridional Gravity Wave Stress (N/m²)
1 variant
Meridional gravity wave stress is the north-south component of momentum flux from unresolved gravity waves. It affects large-scale circulation and jet dynamics.
Level
Info
Horizon
Introduced
Selector
surface0h-5160h
2018-10-31
{"name":"V-GWD","level":"surface","info":""}
Copy
VBDSF
– Visible Beam Downward Solar Flux (W m-2)
1 variant
Visible beam downward solar flux is the direct visible sunlight at the surface. It is important for illumination and solar energy.
Level
Info
Horizon
Introduced
Selector
surface0h-5160h
2018-10-31
{"name":"VBDSF","level":"surface","info":""}
Copy
VDDSF
– Visible Diffuse Downward Solar Flux (W m-2)
1 variant
Visible diffuse downward solar flux is the scattered visible light at the surface. It increases under clouds or aerosol loading.
Level
Info
Horizon
Introduced
Selector
surface0h-5160h
2018-10-31
{"name":"VDDSF","level":"surface","info":""}
Copy
VEG
– Vegetation Fraction (percent)
1 variant
Vegetation fraction is the portion of the grid cell covered by vegetation. It affects albedo, roughness, and evapotranspiration.
Level
Info
Horizon
Introduced
Selector
surface0h-5160h
2018-10-31
{"name":"VEG","level":"surface","info":""}
Copy
VFLX
– Momentum Flux, V Component (N/m²)
1 variant
Momentum flux, v‑component is the north‑south surface stress exerted by the atmosphere. It drives boundary-layer dynamics.
Level
Info
Horizon
Introduced
Selector
surface0h-5160h
2018-10-31
{"name":"VFLX","level":"surface","info":""}
Copy
VGRD
– V-Component of Wind (m/s)
2 variants
V‑component of wind is the north‑south component of the horizontal wind. Combine with u for speed and direction.
Units: m/s.
Combine u and v components to compute speed and direction.
Level
Info
Horizon
Introduced
Selector
1 hybrid level0h-5160h
2018-10-31
{"name":"VGRD","level":"1 hybrid level","info":""}
Copy
10 m above ground0h-5160h
2018-10-31
{"name":"VGRD","level":"10 m above ground","info":""}
Copy
VGTYP
– Vegetation Type (code)
1 variant
Categorical land-use/vegetation class. It is used to set roughness, albedo, canopy properties, and other surface-exchange parameters.
0
Reserved
1
Urban land
2
Agricultural
3
Range land
4
Deciduous forest
5
Coniferous forest
6
Forest/wetland
7
Water
8
Wetlands
9
Desert
10
Tundra
11
Ice
12
Tropical forest
13
Savannah
14-191
Reserved
192-254
Reserved for local use
255
Missing
Level
Info
Horizon
Introduced
Selector
surface0h-5160h
2018-10-31
{"name":"VGTYP","level":"surface","info":""}
Copy
WATR
– Water Runoff (kg/m^2)
1 variant
Water runoff is the amount of water leaving the land surface as runoff during the period. It is useful for hydrology, flooding, and land-surface diagnostics.
Level
Info
Horizon
Introduced
Selector
surface0h-5160h
2018-10-31
{"name":"WATR","level":"surface","info":""}
Copy
WEASD
– Water Equivalent of Accumulated Snow Depth (kg/m^2)
1 variant
Snow water equivalent (SWE) is the total liquid water stored in the snowpack. It integrates depth and density of existing snow.
Units: kg/m^2.
Accumulations represent water-equivalent depth over the output interval; rates describe intensity.
Level
Info
Horizon
Introduced
Selector
surface0h-5160h
2018-10-31
{"name":"WEASD","level":"surface","info":""}
Copy
No parameters match your search.