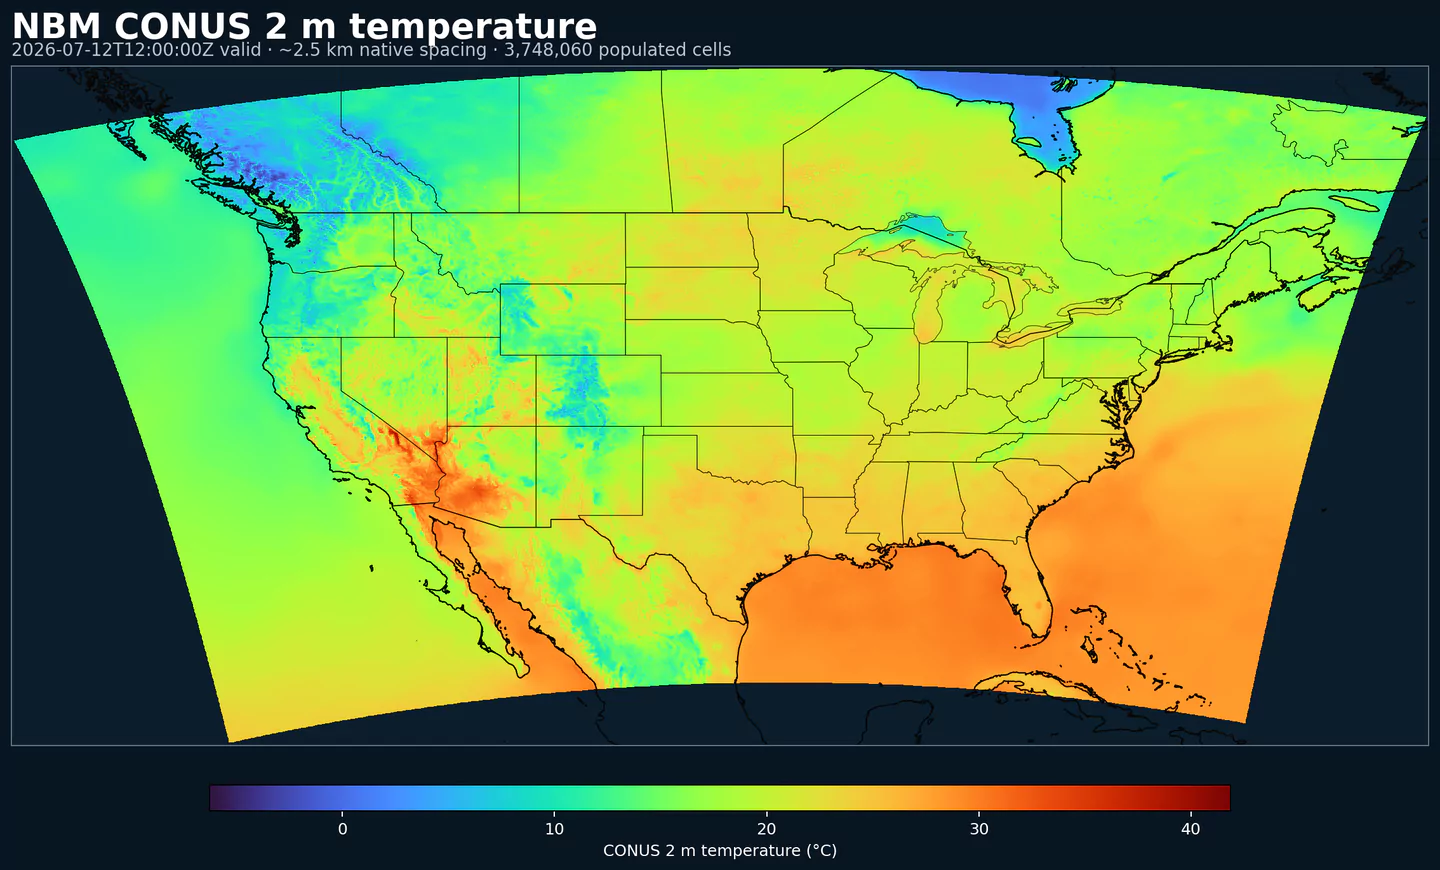
nbm
NBM (National Blend of Models) is NOAA’s flagship post-processing system for gridded forecasts across the United States. It combines a wide suite of numerical weather prediction models—including global, regional, deterministic, and ensemble systems—into a calibrated, high-resolution blend. By merging model guidance from the GFS, HRRR, RAP, GEFS, and international systems such as the ECMWF IFS, NBM creates a unified forecast that balances skill across timescales, geographic regions, and variables.
The blending is performed with statistically sophisticated techniques such as Model Output Statistics (MOS), quantile mapping, and ensemble weighting. Forecasts are bias-corrected against the URMA analysis of record, ensuring consistency and reliability. The NBM framework outputs both deterministic fields (e.g., temperature, wind, QPF) and probabilistic products (e.g., probability of precipitation, percentile guidance, probability of exceedance) that directly support risk-based decision making.
NBM is designed to deliver consistent forecasts nationwide: it provides seamless coverage from short-range (hours) through medium-range (days) horizons, updated on an hourly cycle. Its post-processed nature smooths out discontinuities between different model sources and offers a stable, trusted foundation for the National Weather Service digital forecast grids.
Name | Level | Info | Description | Introduced | Min Horizon | Max Horizon |
---|---|---|---|---|---|---|
APCP | surface | Accumulated Precipitation (kg/m^2) | 2020-09-29T12:00:00Z | 1 | 264 | |
APCP | surface | prob >0.254 | Accumulated Precipitation (kg/m^2) | 2020-09-29T12:00:00Z | 1 | 264 |
APTMP | 2 m above ground | Apparent Temperature (K) | 2020-09-29T12:00:00Z | 1 | 264 | |
ASNOW | surface | Accumulated Snow Depth (m) | 2020-09-29T12:00:00Z | 1 | 264 | |
ASNOW | surface | prob >0.4572 | Accumulated Snow Depth (m) | 2020-09-29T12:00:00Z | 24 | 264 |
ASNOW | surface | prob >0.6096 | Accumulated Snow Depth (m) | 2020-09-29T12:00:00Z | 24 | 264 |
ASNOW | surface | prob >0.762 | Accumulated Snow Depth (m) | 2020-09-29T12:00:00Z | 24 | 264 |
ASNOW | surface | prob >0.1524 | Accumulated Snow Depth (m) | 2020-09-29T12:00:00Z | 6 | 264 |
ASNOW | surface | prob >0.2032 | Accumulated Snow Depth (m) | 2020-09-29T12:00:00Z | 6 | 264 |
ASNOW | surface | prob >0.3048 | Accumulated Snow Depth (m) | 2020-09-29T12:00:00Z | 6 | 264 |
ASNOW | surface | 5% level | Accumulated Snow Depth (m) | 2020-09-29T12:00:00Z | 1 | 264 |
ASNOW | surface | 10% level | Accumulated Snow Depth (m) | 2020-09-29T12:00:00Z | 1 | 264 |
ASNOW | surface | 25% level | Accumulated Snow Depth (m) | 2020-09-29T12:00:00Z | 1 | 264 |
ASNOW | surface | 50% level | Accumulated Snow Depth (m) | 2020-09-29T12:00:00Z | 1 | 264 |
ASNOW | surface | 75% level | Accumulated Snow Depth (m) | 2020-09-29T12:00:00Z | 1 | 264 |
ASNOW | surface | 90% level | Accumulated Snow Depth (m) | 2020-09-29T12:00:00Z | 1 | 264 |
ASNOW | surface | 95% level | Accumulated Snow Depth (m) | 2020-09-29T12:00:00Z | 1 | 264 |
ASNOW | surface | prob >0.127 | Accumulated Snow Depth (m) | 2023-01-16T13:00:00Z | 6 | 263 |
ASNOW | surface | prob >0.00254 | Accumulated Snow Depth (m) | 2020-09-29T12:00:00Z | 1 | 264 |
ASNOW | surface | prob >0.0254 | Accumulated Snow Depth (m) | 2020-09-29T12:00:00Z | 1 | 264 |
ASNOW | surface | prob >0.254 | Accumulated Snow Depth (m) | 2023-01-16T13:00:00Z | 6 | 263 |
ASNOW | surface | prob >0.0508 | Accumulated Snow Depth (m) | 2020-09-29T12:00:00Z | 1 | 264 |
ASNOW | surface | prob >0.1016 | Accumulated Snow Depth (m) | 2020-09-29T12:00:00Z | 1 | 264 |
ASNOW | surface | prob >0.9144 | Accumulated Snow Depth (m) | 2023-01-16T13:00:00Z | 53 | 263 |
ASNOW | surface | prob >0.0762 | Accumulated Snow Depth (m) | 2023-01-16T13:00:00Z | 1 | 263 |
ASNOW | surface | prob >1.219 | Accumulated Snow Depth (m) | 2023-01-16T13:00:00Z | 77 | 263 |
ASNOW | surface | prob >0.00762 | Accumulated Snow Depth (m) | 2023-01-16T13:00:00Z | 1 | 36 |
ASNOW | surface | prob >0.0127 | Accumulated Snow Depth (m) | 2023-01-16T13:00:00Z | 1 | 36 |
ASNOW | surface | prob >0.01778 | Accumulated Snow Depth (m) | 2023-01-16T13:00:00Z | 1 | 36 |
ASNOW | surface | prob >0.0381 | Accumulated Snow Depth (m) | 2023-01-16T13:00:00Z | 1 | 36 |
ASNOW | surface | prob >0.0635 | Accumulated Snow Depth (m) | 2023-01-16T13:00:00Z | 1 | 36 |
CAPE | surface | Convective Available Potential Energy (J/kg) | 2020-09-29T12:00:00Z | 1 | 264 | |
CAPE | surface | ens std dev | Convective Available Potential Energy (J/kg) | 2020-09-29T12:00:00Z | 1 | 264 |
CDCB | reserved | Cloud Base Height (m) | 2023-01-16T13:00:00Z | 1 | 36 | |
CDCB | high cloud layer | Cloud Base Height (m) | 2023-01-16T13:00:00Z | 1 | 36 | |
CEIL | cloud ceiling | Ceiling Height (m) | 2020-09-29T12:00:00Z | 1 | 84 | |
CEIL | cloud base | Ceiling Height (m) | 2020-09-29T12:00:00Z | 1 | 84 | |
CEIL | cloud ceiling | prob <304.8 | Ceiling Height (m) | 2020-09-29T12:00:00Z | 1 | 78 |
CEIL | cloud ceiling | prob <152.4 | Ceiling Height (m) | 2020-09-29T12:00:00Z | 1 | 78 |
CEIL | cloud ceiling | prob <914.5 | Ceiling Height (m) | 2020-09-29T12:00:00Z | 1 | 78 |
CEIL | cloud ceiling | prob <609.6 | Ceiling Height (m) | 2023-01-16T13:00:00Z | 1 | 36 |
CEIL | cloud ceiling | prob <2011.68 | Ceiling Height (m) | 2023-01-16T13:00:00Z | 1 | 36 |
CWASP | surface | 5% level | Craven–Wiedenfeld Aggregate Severe Parameter (unitless) | 2024-04-15T17:00:00Z | 1 | 264 |
CWASP | surface | 10% level | Craven–Wiedenfeld Aggregate Severe Parameter (unitless) | 2024-04-15T17:00:00Z | 1 | 264 |
CWASP | surface | 25% level | Craven–Wiedenfeld Aggregate Severe Parameter (unitless) | 2024-04-15T17:00:00Z | 1 | 264 |
CWASP | surface | 50% level | Craven–Wiedenfeld Aggregate Severe Parameter (unitless) | 2024-04-15T17:00:00Z | 1 | 264 |
CWASP | surface | 75% level | Craven–Wiedenfeld Aggregate Severe Parameter (unitless) | 2024-04-15T17:00:00Z | 1 | 264 |
CWASP | surface | 90% level | Craven–Wiedenfeld Aggregate Severe Parameter (unitless) | 2024-04-15T17:00:00Z | 1 | 264 |
CWASP | surface | 95% level | Craven–Wiedenfeld Aggregate Severe Parameter (unitless) | 2024-04-15T17:00:00Z | 1 | 264 |
CWASP | surface | unknown derived fcst | Craven–Wiedenfeld Aggregate Severe Parameter (unitless) | 2024-04-15T17:00:00Z | 1 | 264 |
CWASP | surface | prob >50 | Craven–Wiedenfeld Aggregate Severe Parameter (unitless) | 2024-04-15T17:00:00Z | 1 | 264 |
CWASP | surface | prob >65 | Craven–Wiedenfeld Aggregate Severe Parameter (unitless) | 2024-04-15T17:00:00Z | 1 | 264 |
CWASP | surface | prob >70 | Craven–Wiedenfeld Aggregate Severe Parameter (unitless) | 2024-04-15T17:00:00Z | 1 | 264 |
CWASP | surface | prob >75 | Craven–Wiedenfeld Aggregate Severe Parameter (unitless) | 2024-04-15T17:00:00Z | 1 | 264 |
CWASP | surface | prob >85 | Craven–Wiedenfeld Aggregate Severe Parameter (unitless) | 2024-04-15T17:00:00Z | 1 | 264 |
DIST | surface - 610 m above ground | Distance to Feature (km) | 2020-09-29T12:00:00Z | 1 | 36 | |
DPT | 2 m above ground | Dew Point Temperature (K) | 2020-09-29T12:00:00Z | 1 | 264 | |
DPT | 2 m above ground | ens std dev | Dew Point Temperature (K) | 2020-09-29T12:00:00Z | 1 | 264 |
DRYTPROB | surface | prob >0 | Dry Thunderstorm Probability (%) | 2022-06-01T12:00:00Z | 3 | 83 |
DSWRF | surface | Downward Shortwave Radiation Flux (W/m^2) | 2020-09-29T12:00:00Z | 1 | 264 | |
ELLINX | 400-300 mb | Ellrod Index (unitless) | 2022-06-01T12:00:00Z | 1 | 259 | |
FICEAC | surface | 5% level | Fractional Ice Accumulation (%) | 2022-06-01T12:00:00Z | 6 | 264 |
FICEAC | surface | 10% level | Fractional Ice Accumulation (%) | 2022-06-01T12:00:00Z | 6 | 264 |
FICEAC | surface | 25% level | Fractional Ice Accumulation (%) | 2022-06-01T12:00:00Z | 6 | 264 |
FICEAC | surface | 50% level | Fractional Ice Accumulation (%) | 2022-06-01T12:00:00Z | 6 | 264 |
FICEAC | surface | 75% level | Fractional Ice Accumulation (%) | 2022-06-01T12:00:00Z | 6 | 264 |
FICEAC | surface | 90% level | Fractional Ice Accumulation (%) | 2022-06-01T12:00:00Z | 6 | 264 |
FICEAC | surface | 95% level | Fractional Ice Accumulation (%) | 2022-06-01T12:00:00Z | 6 | 264 |
FICEAC | surface | prob >0.254 | Fractional Ice Accumulation (%) | 2022-06-01T12:00:00Z | 6 | 264 |
FICEAC | surface | prob >2.54 | Fractional Ice Accumulation (%) | 2022-06-01T12:00:00Z | 6 | 264 |
FICEAC | surface | prob >6.35 | Fractional Ice Accumulation (%) | 2022-06-01T12:00:00Z | 6 | 264 |
FICEAC | surface | prob >12.7 | Fractional Ice Accumulation (%) | 2022-06-01T12:00:00Z | 6 | 264 |
FICEAC | surface | prob >25.4 | Fractional Ice Accumulation (%) | 2022-06-01T12:00:00Z | 6 | 264 |
FICEAC | surface | Fractional Ice Accumulation (%) | 2022-06-01T12:00:00Z | 1 | 264 | |
FOSINDX | surface | Fosberg Fire Weather Index (unitless) | 2020-09-29T12:00:00Z | 6 | 264 | |
FRZSPR | surface | Freezing Spray Indicator (boolean) | 2024-04-15T17:00:00Z | 1 | 240 | |
GUST | 10 m above ground | Wind Gust Speed (m/s) | 2020-09-29T12:00:00Z | 1 | 264 | |
GUST | 10 m above ground | ens std dev | Wind Gust Speed (m/s) | 2020-09-29T12:00:00Z | 1 | 264 |
HAILPROB | surface | prob >0 | Hail Probability (%) | 2023-01-16T15:00:00Z | 4 | 45 |
HINDEX | entire atmosphere (considered as a single layer) | Heat Index (K) | 2020-09-29T12:00:00Z | 6 | 264 | |
HTSGW | surface | Significant Wave Height (m) | 2020-09-29T12:00:00Z | 1 | 240 | |
HTSGW | surface | ens std dev | Significant Wave Height (m) | 2020-09-29T12:00:00Z | 1 | 240 |
HTSGW | surface | 10% level | Significant Wave Height (m) | 2023-01-16T13:00:00Z | 1 | 240 |
HTSGW | surface | 50% level | Significant Wave Height (m) | 2023-01-16T13:00:00Z | 1 | 240 |
HTSGW | surface | 90% level | Significant Wave Height (m) | 2023-01-16T13:00:00Z | 1 | 240 |
MAXREF | 1000 m above ground | Maximum Radar Reflectivity (dBZ) | 2020-09-29T12:00:00Z | 1 | 36 | |
MAXRH | 2 m above ground | Maximum Relative Humidity (%) | 2020-09-29T12:00:00Z | 13 | 264 | |
MINRH | 2 m above ground | Minimum Relative Humidity (%) | 2020-09-29T12:00:00Z | 13 | 264 | |
MIXHT | entire atmosphere (considered as a single layer) | Mixing Height (m) | 2020-09-29T12:00:00Z | 1 | 264 | |
PCPDUR | surface | Precipitation Duration (hours) | 2022-06-01T12:00:00Z | 12 | 264 | |
PTYPE | surface | prob >=3 <4 | Precipitation Type (coded) | 2020-09-29T12:00:00Z | 1 | 264 |
PTYPE | surface | prob >=1 <2 | Precipitation Type (coded) | 2020-09-29T12:00:00Z | 1 | 264 |
PTYPE | surface | prob >=8 <9 | Precipitation Type (coded) | 2020-09-29T12:00:00Z | 1 | 264 |
PTYPE | surface | prob >=5 <7 | Precipitation Type (coded) | 2020-09-29T12:00:00Z | 1 | 264 |
PWTHER | surface - reserved | Probable Weather Type (coded) | 2020-09-29T12:00:00Z | 1 | 264 | |
RETOP | cloud top | Radar Echo Top Height (m) | 2020-09-29T12:00:00Z | 1 | 36 | |
RH | 2 m above ground | Relative Humidity (%) | 2020-09-29T12:00:00Z | 1 | 264 | |
SNOWLR | surface | Snow-Liquid Ratio (unitless) | 2022-06-01T12:00:00Z | 1 | 264 | |
SNOWLR | surface | 5% level | Snow-Liquid Ratio (unitless) | 2023-01-16T13:00:00Z | 1 | 263 |
SNOWLR | surface | 10% level | Snow-Liquid Ratio (unitless) | 2023-01-16T13:00:00Z | 1 | 263 |
SNOWLR | surface | 25% level | Snow-Liquid Ratio (unitless) | 2023-01-16T13:00:00Z | 1 | 263 |
SNOWLR | surface | 50% level | Snow-Liquid Ratio (unitless) | 2023-01-16T13:00:00Z | 1 | 263 |
SNOWLR | surface | 75% level | Snow-Liquid Ratio (unitless) | 2023-01-16T13:00:00Z | 1 | 263 |
SNOWLR | surface | 90% level | Snow-Liquid Ratio (unitless) | 2023-01-16T13:00:00Z | 1 | 263 |
SNOWLR | surface | 95% level | Snow-Liquid Ratio (unitless) | 2023-01-16T13:00:00Z | 1 | 263 |
SNOWLVL | 0 m above mean sea level | Snow Level (m) | 2022-06-01T12:00:00Z | 1 | 264 | |
SNOWLVL | surface | 5% level | Snow Level (m) | 2023-01-16T13:00:00Z | 1 | 263 |
SNOWLVL | surface | 10% level | Snow Level (m) | 2023-01-16T13:00:00Z | 1 | 263 |
SNOWLVL | surface | 25% level | Snow Level (m) | 2023-01-16T13:00:00Z | 1 | 263 |
SNOWLVL | surface | 50% level | Snow Level (m) | 2023-01-16T13:00:00Z | 1 | 263 |
SNOWLVL | surface | 75% level | Snow Level (m) | 2023-01-16T13:00:00Z | 1 | 263 |
SNOWLVL | surface | 90% level | Snow Level (m) | 2023-01-16T13:00:00Z | 1 | 263 |
SNOWLVL | surface | 95% level | Snow Level (m) | 2023-01-16T13:00:00Z | 1 | 263 |
TCDC | reserved | Total Cloud Cover (%) | 2023-01-16T13:00:00Z | 1 | 36 | |
TCDC | high cloud layer | Total Cloud Cover (%) | 2023-01-16T13:00:00Z | 1 | 36 | |
TCDC | surface | Total Cloud Cover (%) | 2020-09-29T12:00:00Z | 1 | 264 | |
TCDC | surface | ens std dev | Total Cloud Cover (%) | 2020-09-29T12:00:00Z | 1 | 264 |
THUNC | entire atmosphere | Thunderstorm Probability (%) | 2023-01-16T13:00:00Z | 1 | 36 | |
TMAX | 2 m above ground | Maximum Temperature (K) | 2020-09-29T12:00:00Z | 12 | 264 | |
TMAX | 2 m above ground | ens std dev | Maximum Temperature (K) | 2020-09-29T12:00:00Z | 12 | 264 |
TMIN | 2 m above ground | Minimum Temperature (K) | 2020-09-29T12:00:00Z | 12 | 264 | |
TMIN | 2 m above ground | ens std dev | Minimum Temperature (K) | 2020-09-29T12:00:00Z | 12 | 264 |
TMP | surface | Temperature (K) | 2020-09-29T12:00:00Z | 1 | 264 | |
TMP | 2 m above ground | Temperature (K) | 2020-09-29T12:00:00Z | 1 | 264 | |
TMP | 2 m above ground | ens std dev | Temperature (K) | 2020-09-29T12:00:00Z | 1 | 264 |
TORPROB | surface | prob >0 | Tornado Probability (%) | 2023-01-16T15:00:00Z | 4 | 45 |
TPWDIR | 10 m above ground | Total Precipitable Water Transport Direction (degrees) | 2024-04-16T01:00:00Z | 1 | 167 | |
TPWSPD | 10 m above ground | Total Precipitable Water Transport Speed (m/s) | 2024-04-16T01:00:00Z | 1 | 167 | |
TRWDIR | entire atmosphere (considered as a single layer) | Tropical Wind Direction (degrees) | 2022-06-01T12:00:00Z | 1 | 264 | |
TRWSPD | entire atmosphere (considered as a single layer) | Tropical Wind Speed (m/s) | 2022-06-01T12:00:00Z | 1 | 264 | |
TSRWE | surface | prob >7.35e-05 | Tropical Storm Wind Estimate (m/s) | 2020-09-29T12:00:00Z | 25 | 264 |
TSTM | surface | probability forecast | Thunderstorm Indicator (boolean) | 2020-09-29T12:00:00Z | 1 | 192 |
TSTM | surface | prob >0 | Thunderstorm Indicator (boolean) | 2023-01-16T15:00:00Z | 1 | 45 |
TURB | surface - 1372 m above ground | Turbulence Index (unitless) | 2020-09-29T12:00:00Z | 1 | 264 | |
VIL | entire atmosphere | Vertically Integrated Liquid (kg/m^2) | 2020-09-29T12:00:00Z | 1 | 36 | |
VIS | surface | Visibility (km) | 2020-09-29T12:00:00Z | 1 | 79 | |
VIS | surface | prob <1609.34 | Visibility (km) | 2020-09-29T12:00:00Z | 1 | 78 |
VIS | surface | prob <4828.03 | Visibility (km) | 2020-09-29T12:00:00Z | 1 | 78 |
VIS | surface | prob <8046.73 | Visibility (km) | 2020-09-29T12:00:00Z | 1 | 78 |
VIS | surface | prob <3218.69 | Visibility (km) | 2023-01-16T13:00:00Z | 1 | 36 |
VRATE | entire atmosphere (considered as a single layer) | Vertical Velocity (m/s) | 2020-09-29T12:00:00Z | 1 | 264 | |
WDIR | surface - 610 m above ground | Wind Direction (degrees) | 2020-09-29T12:00:00Z | 1 | 36 | |
WDIR | 30 m above ground | Wind Direction (degrees) | 2020-09-29T12:00:00Z | 1 | 264 | |
WDIR | 10 m above ground | Wind Direction (degrees) | 2020-09-29T12:00:00Z | 1 | 264 | |
WDIR | 80 m above ground | Wind Direction (degrees) | 2020-09-29T12:00:00Z | 1 | 264 | |
WIND | surface - 610 m above ground | Wind Speed (m/s) | 2020-09-29T12:00:00Z | 1 | 36 | |
WIND | 30 m above ground | Wind Speed (m/s) | 2020-09-29T12:00:00Z | 1 | 264 | |
WIND | 10 m above ground | Wind Speed (m/s) | 2020-09-29T12:00:00Z | 1 | 264 | |
WIND | 80 m above ground | Wind Speed (m/s) | 2020-09-29T12:00:00Z | 1 | 264 | |
WIND | 10 m above ground | ens std dev | Wind Speed (m/s) | 2020-09-29T12:00:00Z | 1 | 264 |
WINDPROB | surface | prob >0 | Wind Probability (%) | 2023-01-16T15:00:00Z | 4 | 45 |