
GribStream Blog
El Niño 2026: what the forecast archive reveals
CFS forecast September’s warming but missed its strength in April–June. We replay 40 runs and compare their errors with NOAA observations and persistence.
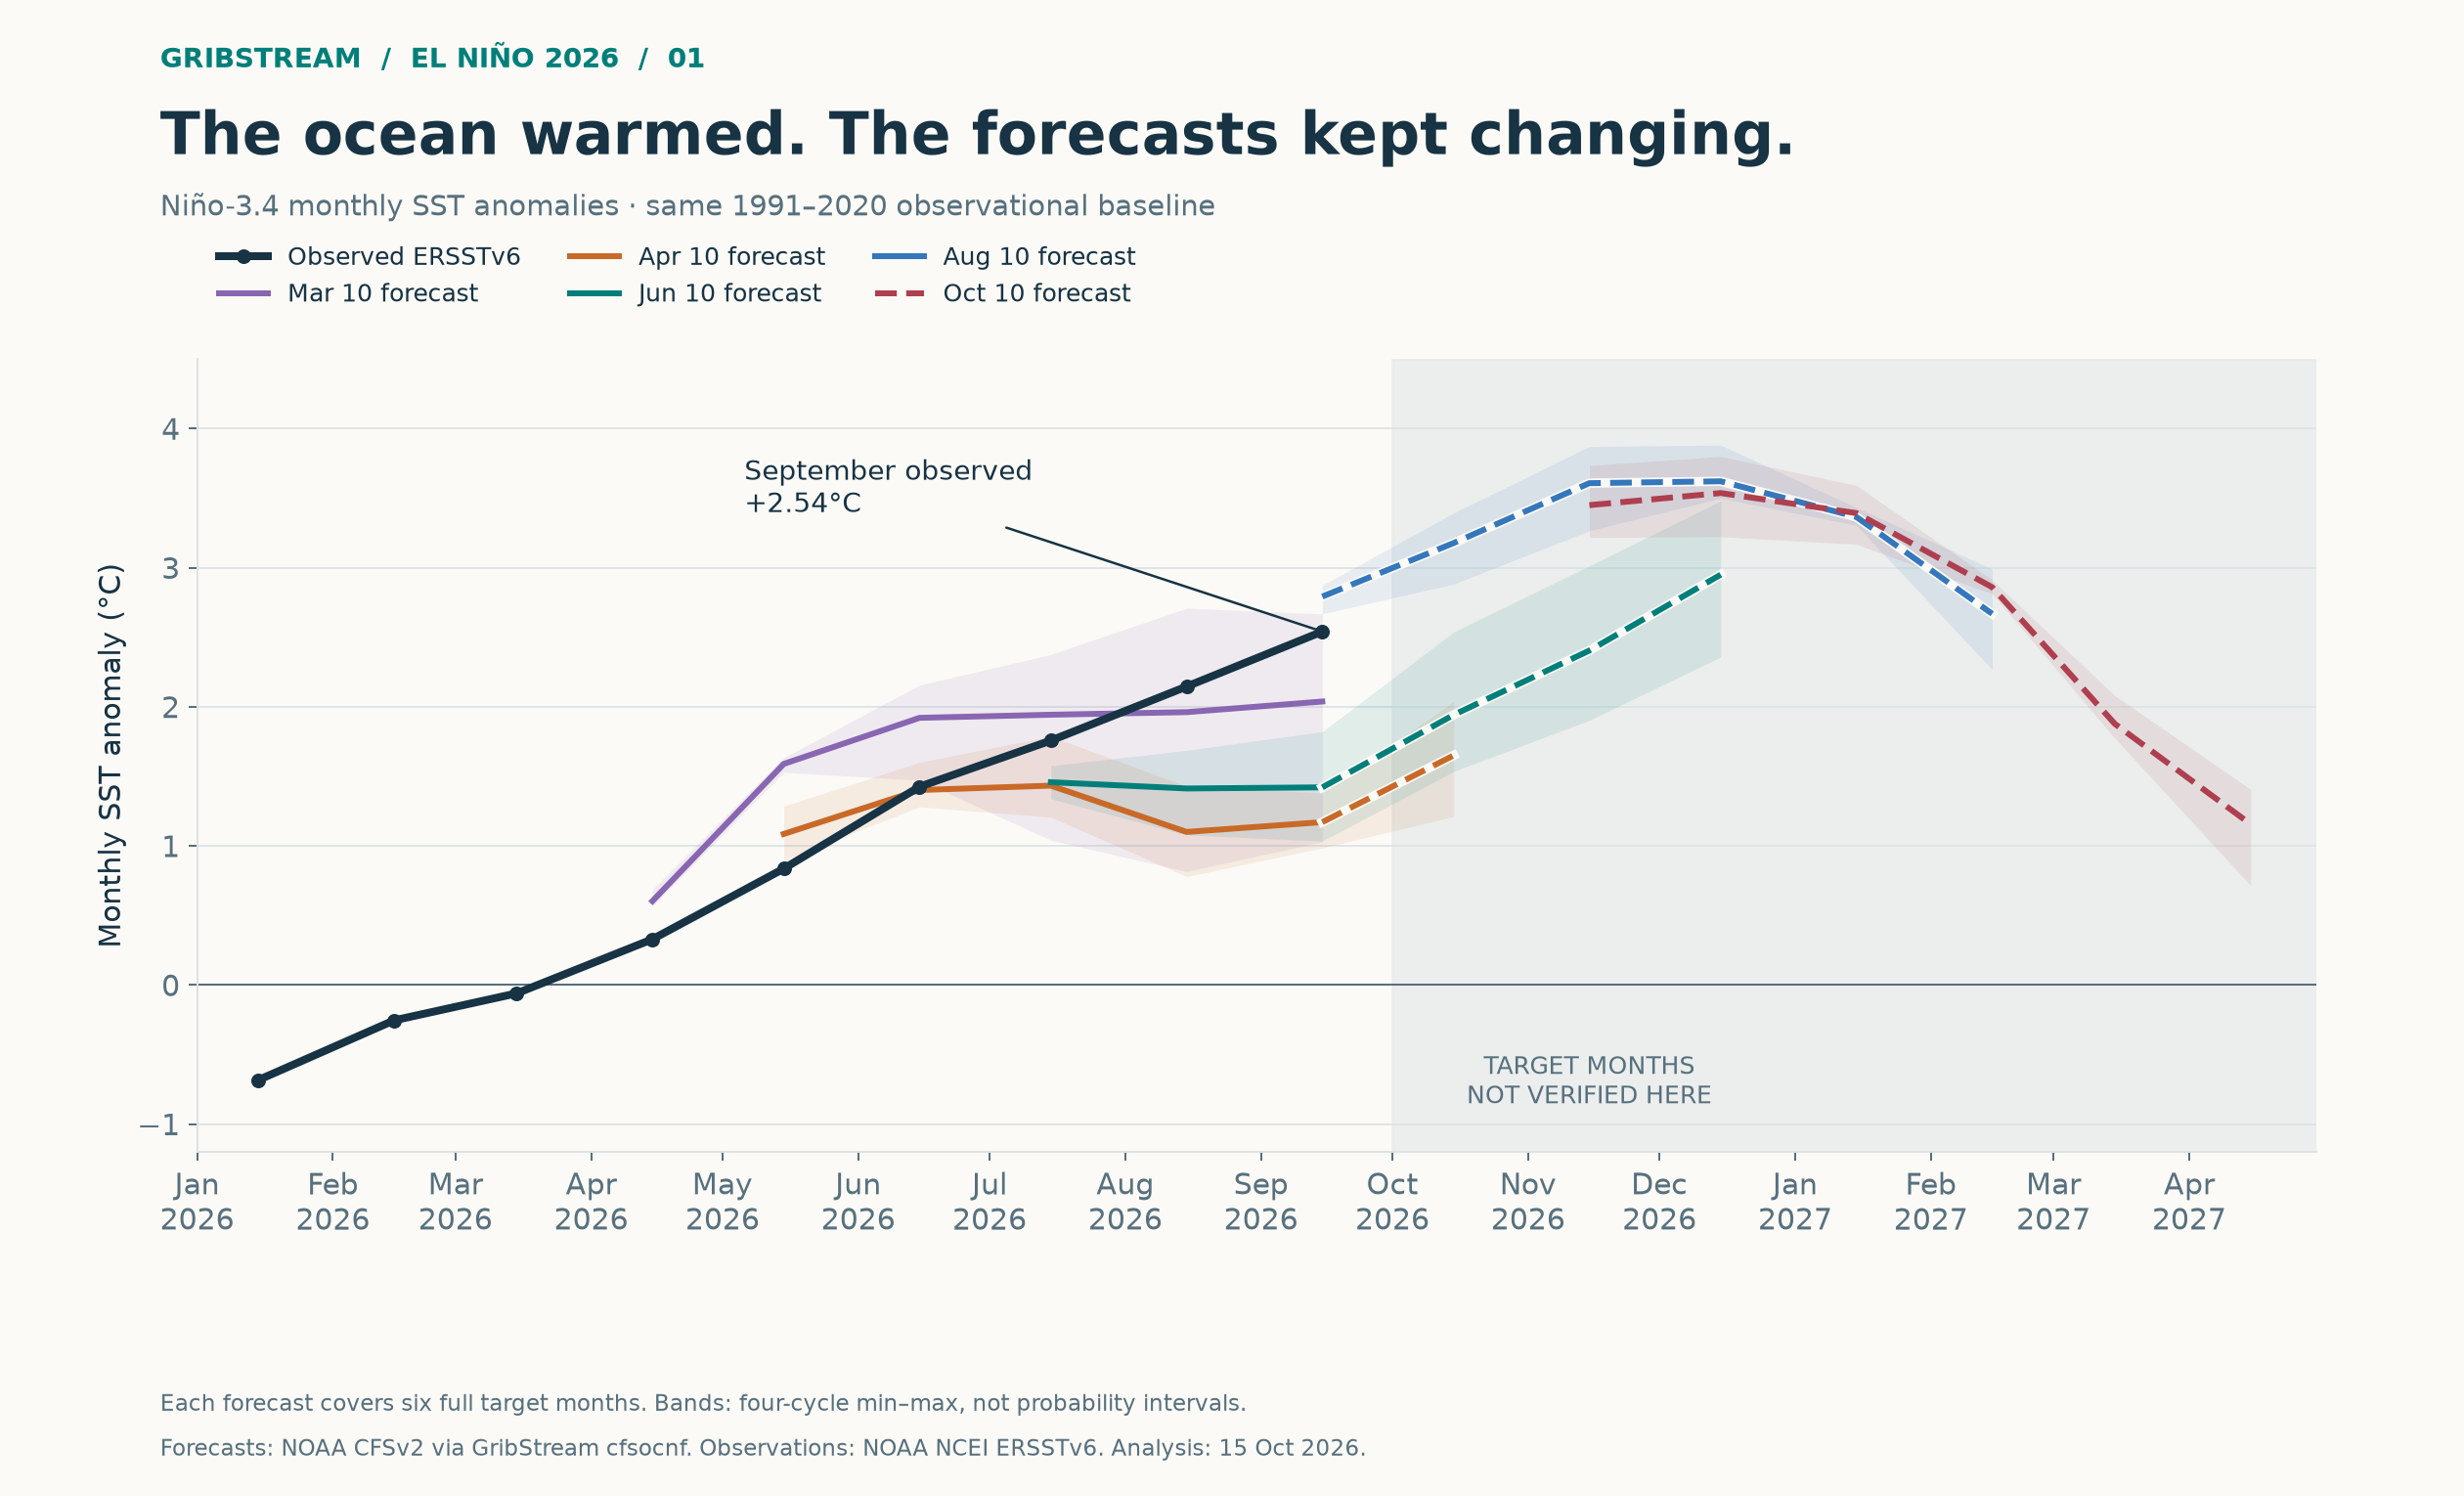
In April, the sampled forecasts put September’s Niño-3.4 warming at +1.17°C. September arrived at +2.54°C. By August, the prediction had climbed to +2.79°C.
The model anticipated warming, but underestimated its strength through much of the northern spring and early summer. Its revisions also took a wrong turn: March’s prediction was closer to September’s outcome than those issued in April, May or June.
We compared 40 NOAA CFSv2 runs from GribStream’s CFS Ocean archive with NOAA’s independent ERSSTv6 ocean analysis. The comparison covers observations through September, with an October 15, 2026 cutoff. Anomalies measure the departure from the 1991–2020 average for the same month in Niño-3.4, the equatorial Pacific region spanning 5°S–5°N and 170°W–120°W.
From a cool Pacific to rapid warming
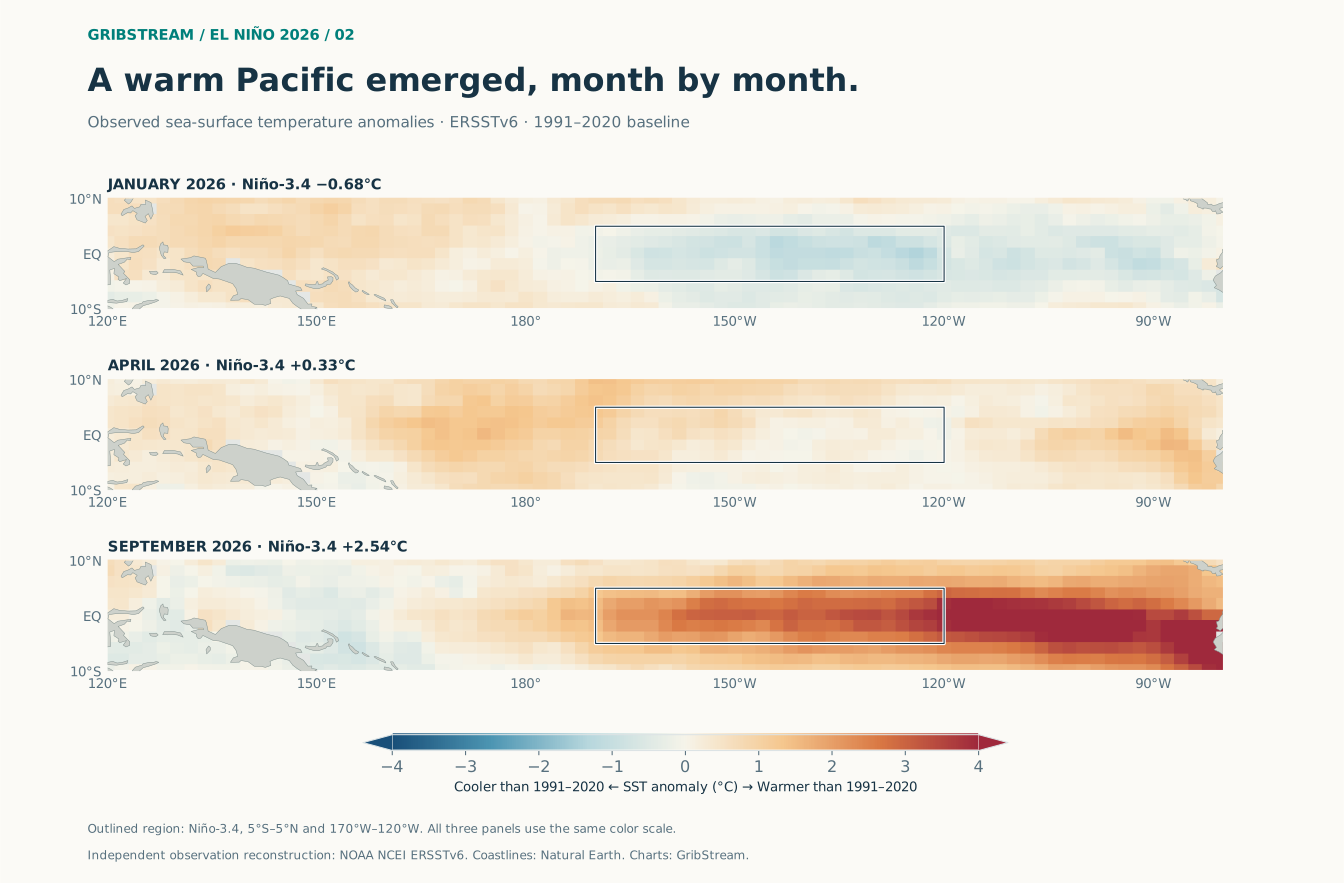
The regional anomaly rose from −0.68°C in January to +0.33°C in April and +2.54°C in September: a 3.22°C increase over eight months.
January still had a cool equatorial band across the central and eastern Pacific. By September, a pronounced warm band extended across Niño-3.4, with even larger anomalies farther east.
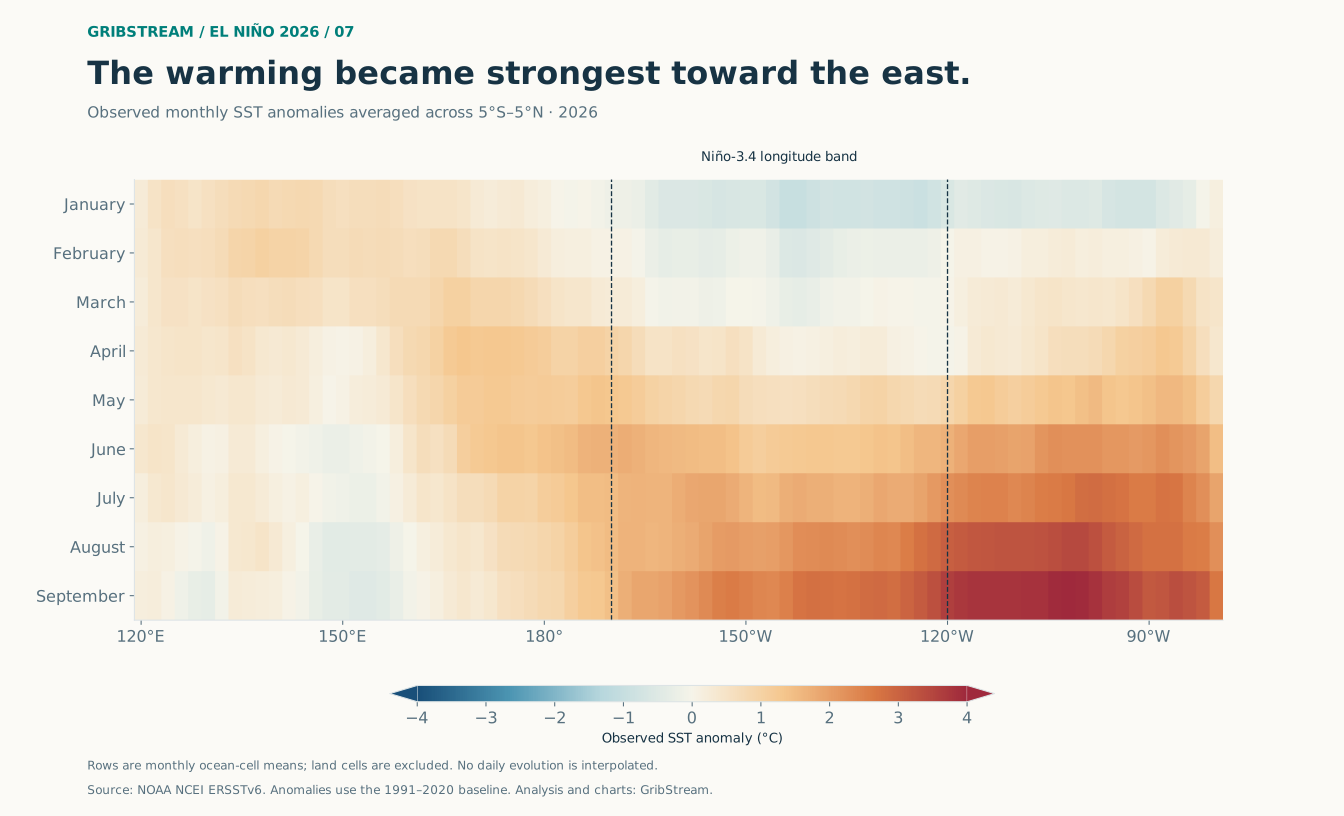
NOAA NCEI’s ERSSTv6 reconstructs monthly sea-surface temperatures from ships, buoys and Argo floats. The longitude–time view traces the expansion and intensification of the equatorial warming across the nine months.
April’s forecasts backed away from the warming
We sampled the 00, 06, 12 and 18 UTC runs on the 10th of each month, January through October. Each prediction below is the average of those four runs. Holding September as the target reveals how the expected warming changed:
| Forecast issued | Predicted September anomaly | Error against +2.54°C observed |
|---|---|---|
| March 10 | +2.04°C | −0.50°C |
| April 10 | +1.17°C | −1.37°C |
| May 10 | +1.40°C | −1.15°C |
| June 10 | +1.42°C | −1.12°C |
| July 10 | +2.11°C | −0.43°C |
| August 10 | +2.79°C | +0.25°C |
Query the April 10 inputs
Fetch the four April 10 runs used in the table. The request includes targets beyond September and returns raw six-hourly sea-surface temperature in Kelvin.
Set GRIBSTREAM_API_TOKEN to your API token. Create an account or sign in.
curl --fail-with-body --compressed \
  'https://gribstream.com/api/v2/cfsocnf/runs' \
  -H "Authorization: Bearer ${GRIBSTREAM_API_TOKEN:?Set GRIBSTREAM_API_TOKEN}" \
  -H 'Content-Type: application/json' \
  -H 'Accept: text/csv' \
  --output cfsocnf-2026-04-10.csv \
  --data-binary @- <<'GRIBSTREAM_REQUEST'
{
  "timesList": [
    "2026-04-10T00:00:00Z",
    "2026-04-10T06:00:00Z",
    "2026-04-10T12:00:00Z",
    "2026-04-10T18:00:00Z"
  ],
  "minHorizon": 6,
  "maxHorizon": 5160,
  "grid": {
    "minLatitude": -4,
    "maxLatitude": 4,
    "minLongitude": -170,
    "maxLongitude": -120,
    "step": 2
  },
  "variables": [
    {
      "name": "TMP",
      "level": "surface",
      "info": "",
      "alias": "sst_k"
    }
  ]
}
GRIBSTREAM_REQUEST
The table’s anomaly uses September regional monthly means and the ERSSTv6 1991–2020 baseline. See the calculation details.
Sort returned rows before processing. Replays may reflect later source corrections; our retained responses are the reference for the published values. This request uses your account’s query allowance.
April through June underestimated September’s warming by more than 1°C. March had already predicted +2.04°C, but April revised that down to +1.17°C. July moved closer to the observed outcome, and August overshot slightly.
The individual March runs spanned +1.03°C to +2.67°C for September. That spread shows how much the result depended on initialization; four runs do not establish calibrated probabilities.
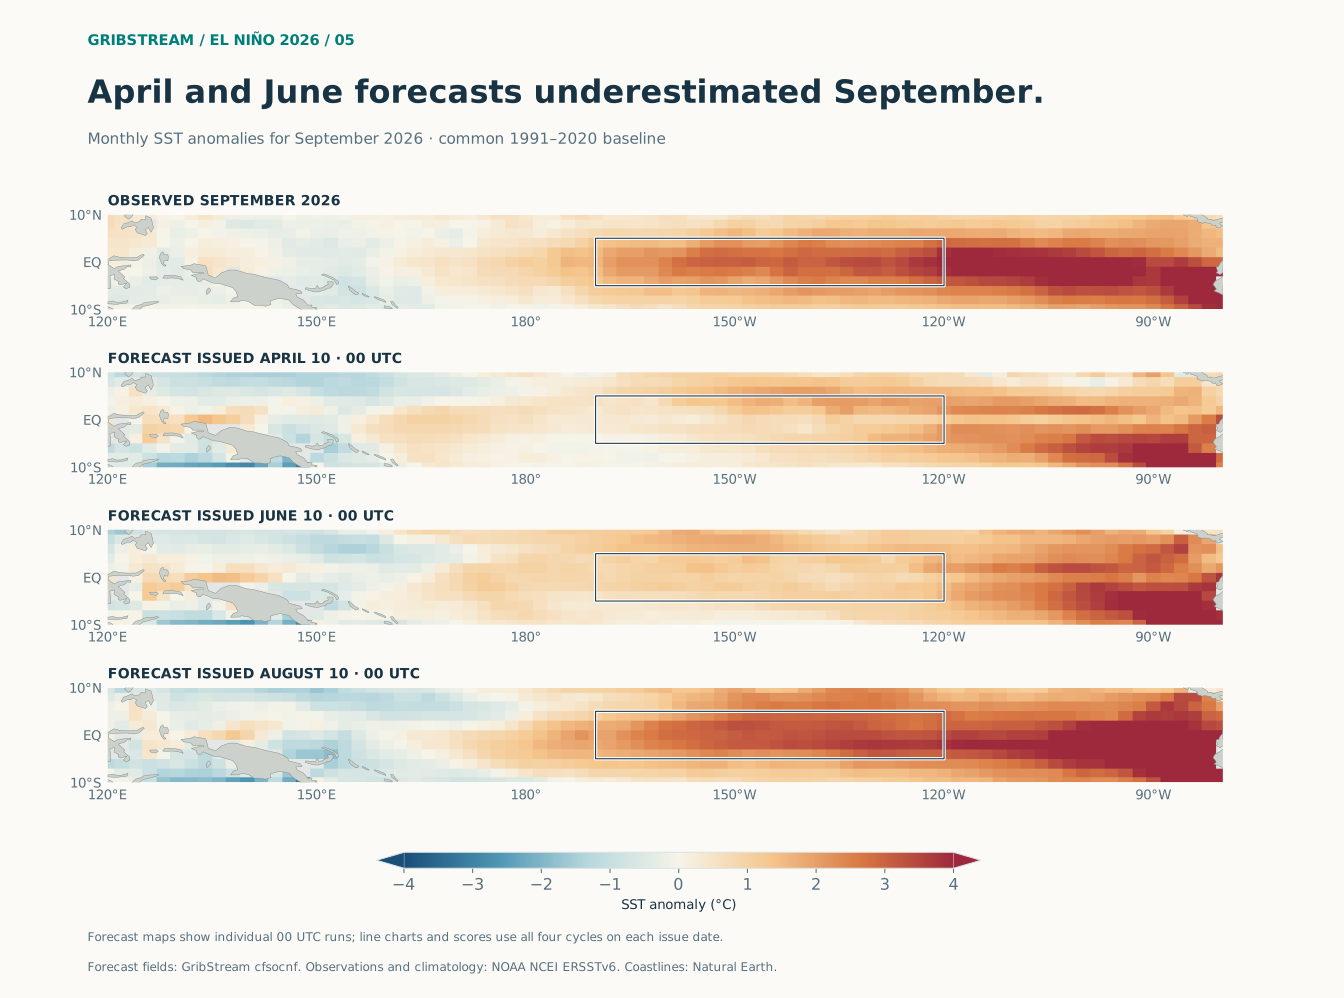
The maps show where the forecasts fell short. The illustrated April and June runs produced warming in the eastern Pacific while leaving Niño-3.4 much cooler than it became. By August, the predicted warm band extended more strongly across the region.
How large were the forecast errors?
Across 33 issue-month/target-month pairs, the forecasts tended to underestimate the warming. The matrix includes every complete future target month in the sampled runs that could be checked against observations through September.
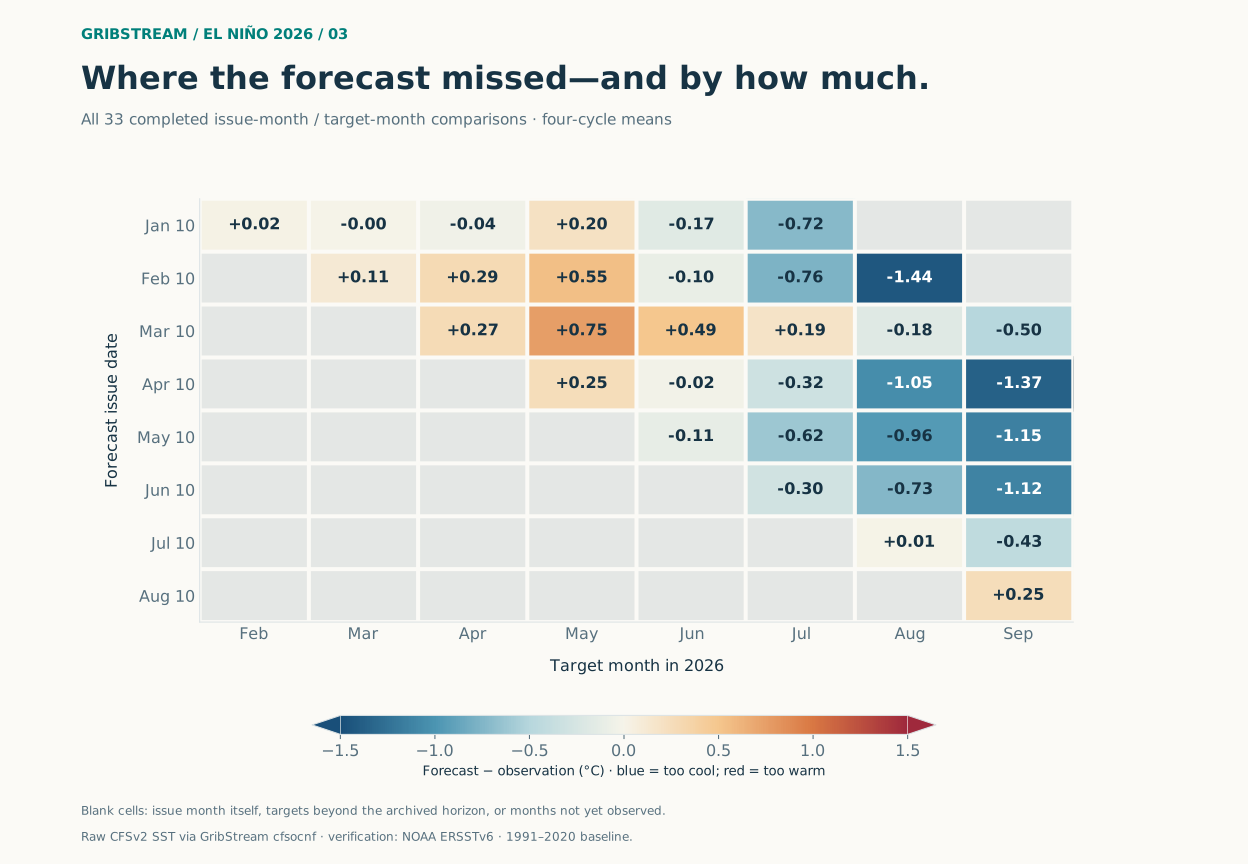
The root mean square error (RMSE) was 0.62°C. This measure gives more weight to large misses. Mean absolute error was 0.47°C, and mean signed error was −0.26°C, reflecting the overall cool bias.
RMSE increased from 0.20°C for the next calendar month to 0.69°C at three months and 0.97°C at six months. At six months, the mean signed error was −0.89°C: most of the error was underprediction.
Longer leads also contain fewer cases and different target months. These overlapping forecasts of one event show how CFS handled this warming episode; they do not establish its typical seasonal forecast skill.
Did the model beat persistence?
We compared CFS with a persistence forecast that holds the starting temperature anomaly constant while retaining the normal seasonal cycle. The starting anomaly comes from each run’s first forecast, at +6 hours, so this benchmark uses the model’s initial ocean state.
Over the same 33 cases, persistence had 1.71°C RMSE, compared with 0.62°C for CFS. CFS had lower error at every sampled monthly lead, showing useful information about the warming beyond the starting anomaly.
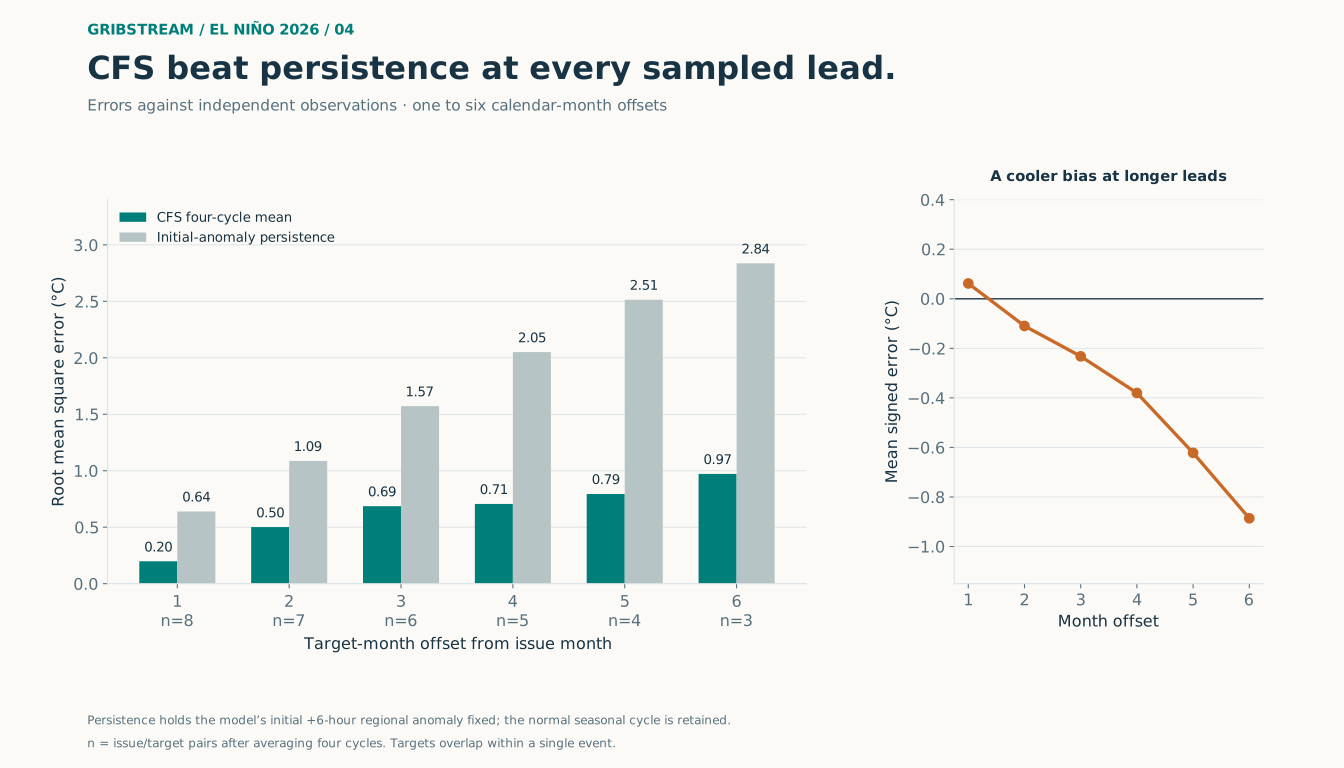
For September alone, however, August’s starting anomaly was already close to the eventual observation. Persistence missed by −0.03°C, while CFS overshot by +0.25°C. Forecasting further warming made that particular prediction worse.
Is this already a “super El Niño”?
The conventional ONI uses three-month Niño-3.4 anomalies. RONI, which NOAA adopted for official monitoring in February 2026, also adjusts for tropical-wide warming and rescales the relative index.
The observed three-month RONI reached +1.69°C for July–September. September’s monthly relative index was +2.08°C. These measure a different quantity from the conventional monthly anomaly of +2.54°C calculated above.
NOAA’s October 8 diagnostic discussion assigned an 83% chance of three-month RONI reaching at least +2.5°C in October–December. The median in its October outlook was +2.74°C for that season. The projected peak was still ahead of the observations available on October 15.
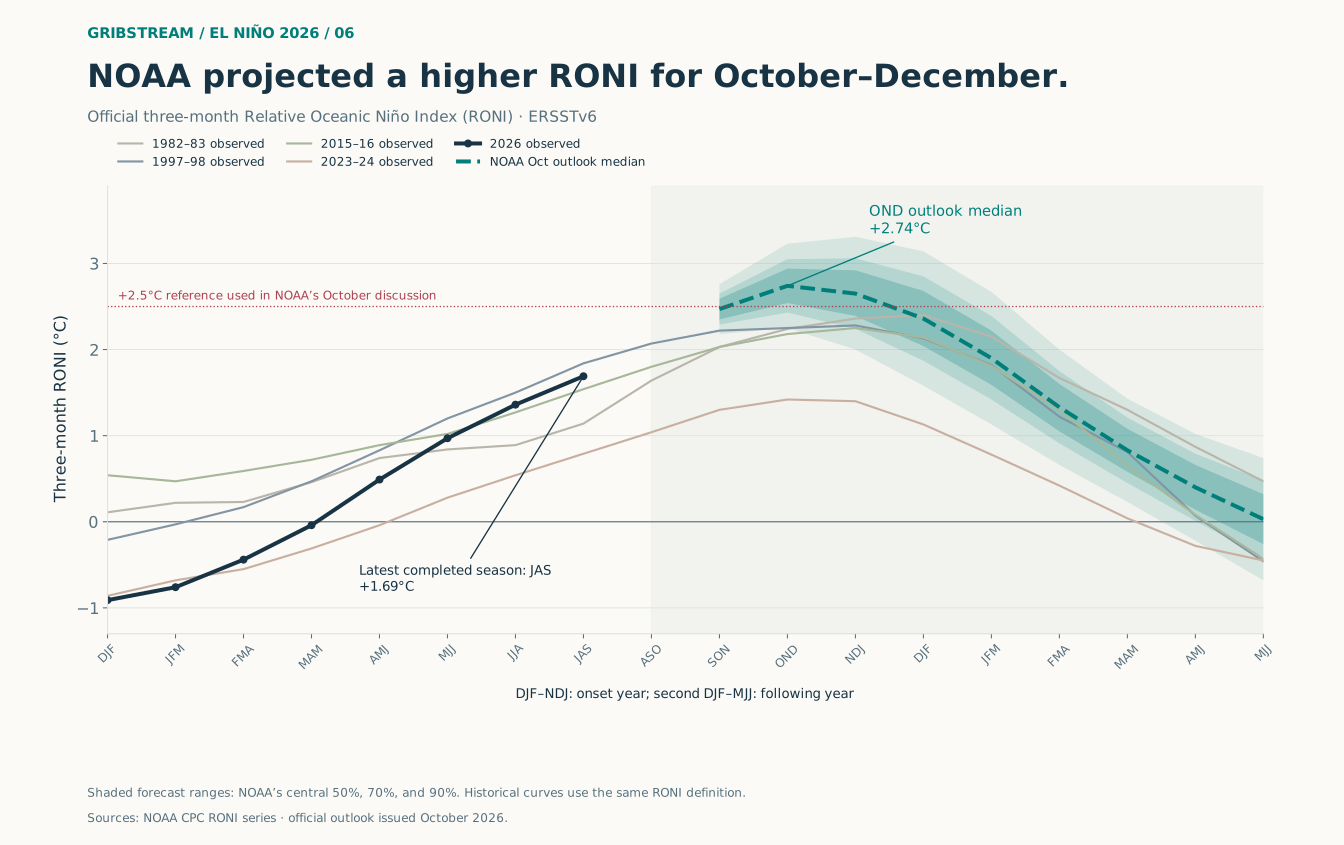
The historical curves compare events using the same RONI definition. Until the projected peak is observed, it cannot settle 2026’s ranking against earlier events.
What the results mean
CFS captured the direction of the ocean’s evolution and beat persistence across this sample. Its main weakness was the amplitude of the warming several months ahead. April’s retreat from March’s stronger forecast shows why an update deserves scrutiny even when the broader warming signal persists.
These results concern Pacific sea-surface temperature. Regional rainfall and heat depend on the season and other influences; their forecast accuracy requires separate evaluation.
Data and methods
We used raw CFS Ocean (cfsocnf) fields from NOAA CFSv2 operational forecasts, retrieved through GribStream’s /api/v2/cfsocnf/runs endpoint. ERSSTv6 observations and CPC indices came separately from NOAA.
These scores apply to the sampled raw fields. NOAA’s published CFS products use larger forecast collections, hindcast climatologies and, for some Niño products, additional corrections. The official CPC outlook combines models and expert assessment. Its accuracy is not measured by this comparison. CFSv2 product methods.
Calculation details
We retrieved six-hourly TMP at surface from the native 1° CFS Ocean grid, converted Kelvin to Celsius, and averaged the regional monthly values across four runs. We scored only complete target months after the issue month; leads are calendar-month offsets.
We sampled CFS on the ERSSTv6 2° grid: five latitude centers from −4° to +4°, and 26 longitude centers from −170° to −120°. Cosine-latitude weights and half weights at the longitude boundaries represent the Niño-3.4 box. This is common-grid sampling, not conservative remapping. A native 1° check of the April 10 00 UTC September forecast changed its regional mean by 0.005°C.
We calculated monthly climatology as ERSSTv6 SST minus its supplied anomaly and used the same baseline for forecasts, without model-bias correction. RMSE is the square root of the mean squared forecast error after averaging four cycles; each of the 33 issue/target pairs has equal weight. Verification uses observations retrieved on October 15, which may later be revised.
Download the analysis tables and exact requests. The API documentation explains how to query additional runs or extend the comparison.
Sources
- NOAA CFSv2 operational forecasts and source attribution; forecast values accessed through GribStream on October 15, 2026.
- NOAA NCEI ERSSTv6 product, methods and research references and monthly NetCDF files.
- CPC three-month RONI observations and monthly relative Niño-3.4 observations.
- CPC ENSO diagnostic discussion, October 8, 2026 and October RONI outlook, captured October 15.
- NOAA CFSv2 seasonal-product methodology. Coastline geometry: Natural Earth.
All figures are original GribStream analyses of the attributed datasets. The calculations and interpretations are ours; they do not imply NOAA endorsement.