
GribStream Blog
Trudy’s 53 km/h wind-forecast split near Manzanillo
IFS and Met Office differed by 53 km/h near Manzanillo. IFS later cut its forecast, while NBM Oceanic kept coastal winds near 103–105 km/h.
IFS and the Met Office put the storm-area wind maximum at almost the same strength. Along Mexico’s coast, their forecasts separated sharply. The next day’s IFS run closed much of that gap; NBM Oceanic kept a higher coastal forecast.
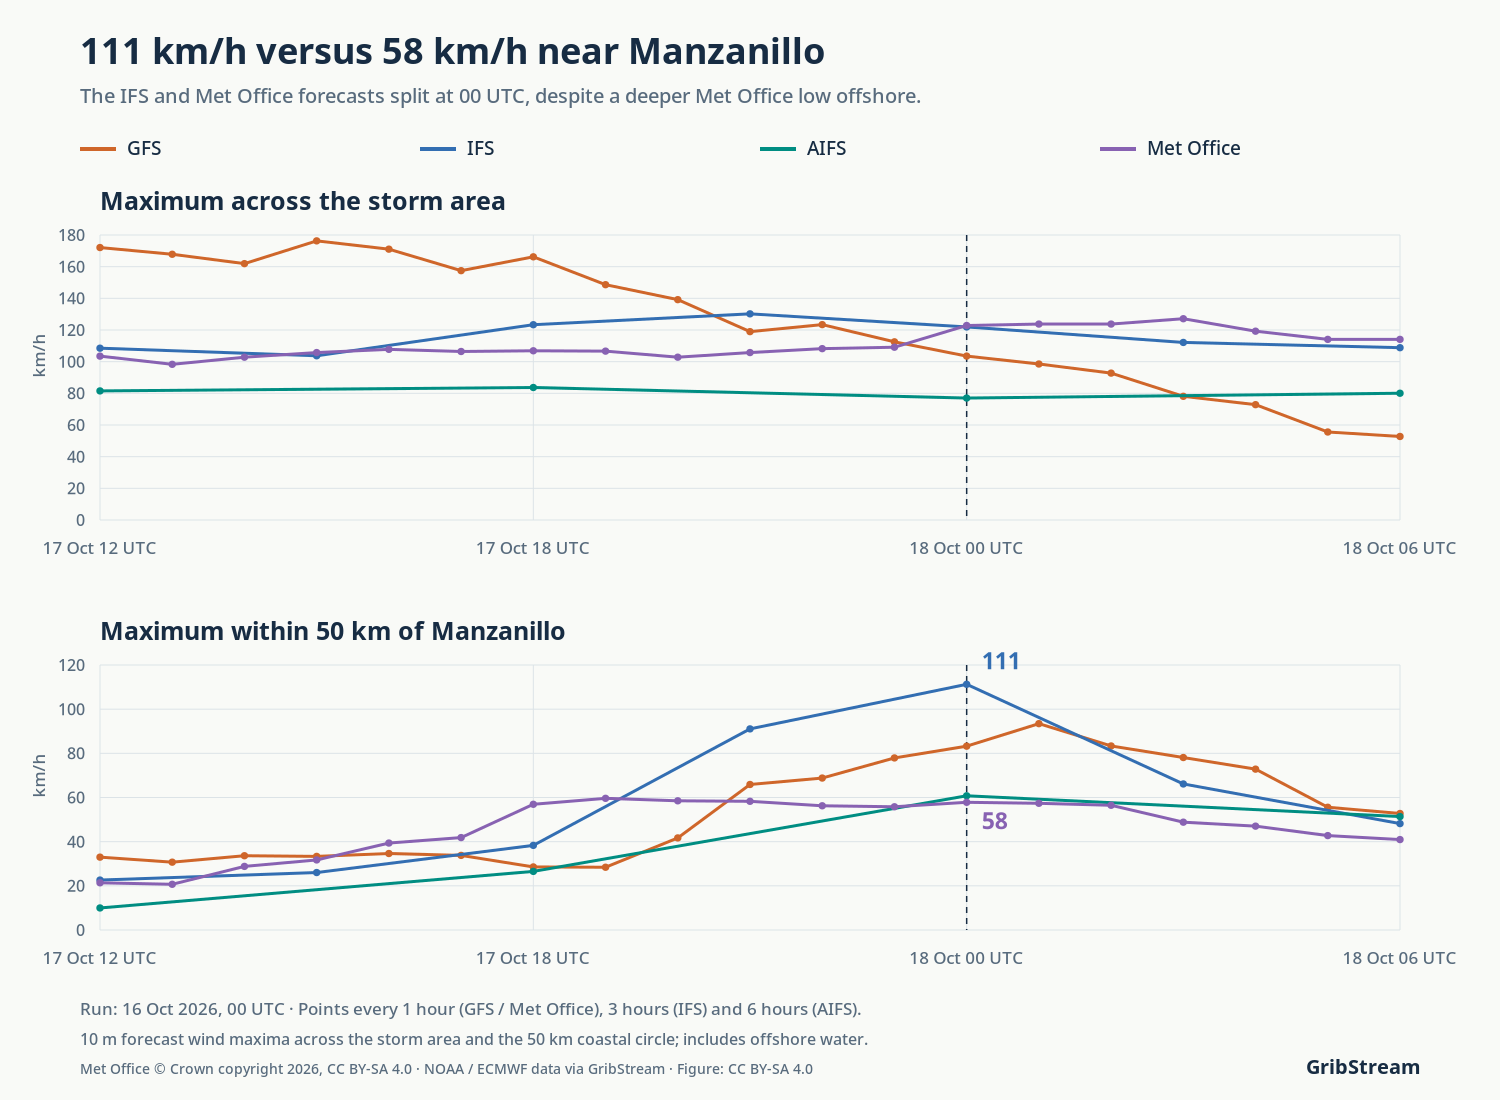
For Saturday evening near Manzanillo, the IFS forecast reached 111 km/h inside a 50 km circle around the city. The Met Office forecast reached 58 km/h. Across the wider storm area, the two models’ maximum winds were almost identical: about 122 and 123 km/h.
These 48-hour forecasts, initialized at 00 UTC on October 16, cover 18:00 CST on Saturday, October 17 (00 UTC on October 18). The coastal values are the strongest forecast winds across the sea and land within 50 km of Manzanillo.
AIFS sits near the Met Office forecast at 61 km/h inside the circle. GFS falls between them and IFS, at 83 km/h.

The Met Office low sits 115 km farther from Manzanillo
The pressure minimum in the Met Office forecast lay about 194 km from Manzanillo. In IFS, it was about 79 km away. More of the IFS wind band reaches the coastal circle, while the Met Office’s compact circulation stays farther southwest.
The Met Office also had the deeper low: 982 hPa against 988 hPa in IFS. Its stronger pressure depression sits farther offshore, alongside weaker winds near Manzanillo. Central pressure and local wind exposure point toward different models in these forecasts.
That spatial difference fits the concern raised by the NHC on October 16: small changes in Trudy’s coast-parallel path could alter the severity of coastal impacts. NHC discussion, October 16 at 09 UTC.
GFS weakens from 172 to 53 km/h in 18 hours
In the October 16 GFS run, the maximum wind over the fixed storm area falls from 172 km/h at 06:00 CST on Saturday to 53 km/h at midnight. At the start of that window, the Met Office maximum is about 104 km/h; at the end, it is 114 km/h.
GFS predicts the stronger storm-area peak early in the sequence. By the Saturday-evening checkpoint, its storm-area maximum is 104 km/h, below IFS and Met Office at 122 and 123 km/h. The GFS band of strong winds contracts as its pressure minimum rises.

IFS cuts its coastal wind forecast by 37 km/h
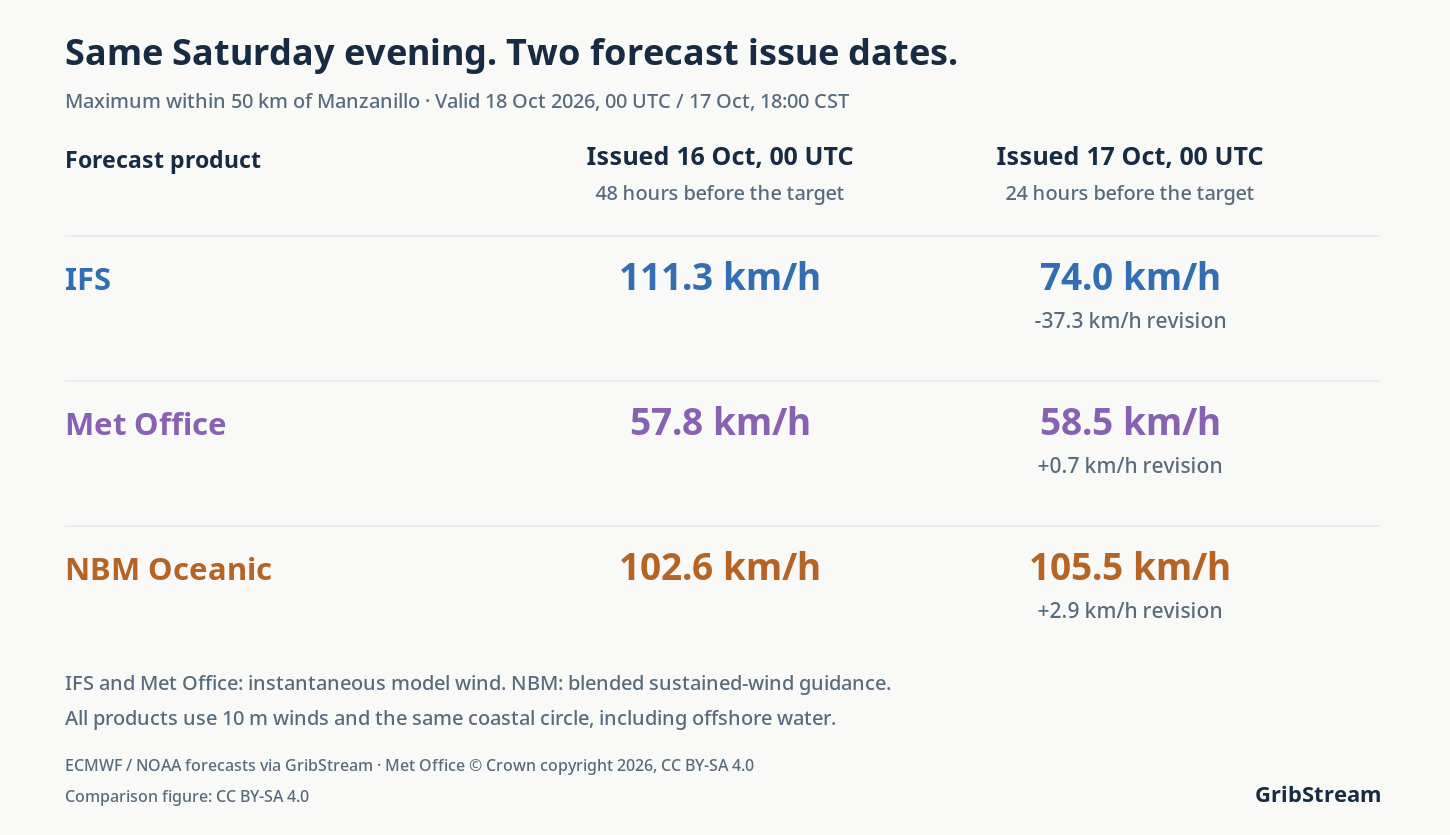
For the same Saturday-evening hour and 50 km circle, the IFS run issued on October 17 at 00 UTC lowers the maximum from 111 to 74 km/h. The Met Office changes from 58 to 59 km/h. Their difference contracts from 53.4 to 15.5 km/h, mostly through the IFS revision.
| Forecast product | 2026-10-16 00 UTC | 2026-10-17 00 UTC |
|---|---|---|
| IFS | 111.3 km/h | 74.0 km/h |
| Met Office | 57.8 km/h | 58.5 km/h |
| NBM Oceanic | 102.6 km/h | 105.5 km/h |
NBM Oceanic keeps coastal winds near 103–105 km/h
The National Blend of Models’ Oceanic product adds another forecast for this stretch of coast. Its October 16 run gives a maximum of 102.6 km/h within the same 50 km circle at the same Saturday-evening hour. The October 17 run gives 105.5 km/h.
The narrowing between IFS and Met Office therefore leaves a substantial difference from NBM: in the later runs, NBM remains about 31 km/h above IFS and 47 km/h above Met Office. NBM supplies post-processed, blended sustained-wind guidance; the other four products supply instantaneous model winds. Its published wind statistic and forecast role are retained in this comparison.
The IFS wind footprint reaches farther across the coastal area
In the October 16 runs, IFS remains higher than Met Office across circles of 25 and 100 km around Manzanillo: about 85 versus 48 km/h in the smaller circle, and 122 versus 73 km/h in the larger one, at the same Saturday-evening checkpoint.
Sampling the Met Office field at the IFS 0.25° grid points gives a 50 km maximum of 56 km/h, compared with 111 km/h for IFS. The spatial 95th percentile also separates the two forecasts: about 99 versus 55 km/h. The higher IFS winds extend across several points in the coastal area.
Explore the Met Office, IFS, GFS, AIFS and NBM Oceanic archives in GribStream to examine wind exposure around your own locations.
Data, observations and calculation details
GFS, IFS, AIFS and Met Office values are instantaneous model wind speed at 10 m, converted from m/s to km/h. NBM Oceanic uses its unqualified 10 m WIND selector, a sustained-wind guidance field. The fixed storm area is 15–22°N, 110–102°W. Coastal maxima use grid-point centers within a great-circle distance of 25, 50 or 100 km from 19.05°N, 104.32°W. Each circle includes sea and land cells. The analysis compares forecasts and revisions across two initialization dates.
Met Office retains its native served output grid, 0.140625° longitude by 0.09375° latitude, from the nominal 10 km model. GFS, IFS and AIFS use their 0.25° served grids. The main window contains 19 hourly GFS and Met Office outputs, seven 3-hourly IFS outputs and four 6-hourly AIFS outputs. NBM Oceanic retains 6,468 native 10 km Mercator grid centers in the storm box and seven actual 3-hourly outputs. The later NBM request covers the 100 km circle at the checkpoint. All checkpoint comparisons hold valid time fixed; the two issue dates have 48- and 24-hour leads.
NBM’s unqualified wind and its 50th-percentile wind are separate published fields. The maxima of the 50th-percentile field within 50 km are 37.4 and 54.0 km/h in the October 16 and 17 runs; the article’s 102.6 and 105.5 km/h values use the unqualified field. NOAA NBM wind definitions. NBM CONUS, HRRR, the RRFS CONUS product currently served by GribStream, and RTMA/URMA have grids that exclude Manzanillo. The Oceanic NBM domain covers the area. NOAA RTMA/URMA domains.
An airport spot check uses the Iowa Environmental Mesonet METAR archive for MMZO (19.1448°N, 104.5586°W). Reports around the checkpoint give 8 knots (14.8 km/h) at 23:42 UTC on October 17, 10 knots (18.5 km/h) at 01:06 UTC and 25 knots (46.3 km/h) at 01:41 UTC on October 18. The retrieved archive has no report exactly at 00 UTC and retains irregular reporting gaps; gusts are missing. These observations describe one airport. Assessing the forecast maximum over the coastal circle requires observations matched in time, location and wind averaging period across that area. No model accuracy ranking is assigned.
The maps retain their original cells. White contours join native pressure samples at 10 hPa intervals; paths connect successive pressure minima. Minimum positions and distances describe sampled forecast fields. The 95th percentile is a spatial grid-point statistic at 00 UTC. Met Office data and derived comparison figures are attributed under CC BY-SA 4.0. Met Office data specification.
Download the forecast CSVs, observations, exact requests, calculations and plotting code.