
GribStream Blog
NOAA MRMS radar, hail, rainfall, and rotation data now on GribStream
Explore NOAA MRMS composite reflectivity, MESH hail size, precipitation rate, multi-sensor rainfall, radar quality, and low-level azimuthal shear through GribStream.
GribStream now provides six operational products from NOAA's Multi-Radar/Multi-Sensor system (MRMS): quality-controlled composite reflectivity, Maximum Estimated Size of Hail (MESH), surface precipitation rate, one-hour Multi-Sensor QPE Pass 2, Radar Quality Index, and 0-2 km azimuthal shear.
MRMS is much more than a stitched radar image. Developed by NOAA's National Severe Storms Laboratory and research partners, the system converts observations from many weather radars and supporting environmental datasets into rapidly updating national analyses. It has run operationally at the National Centers for Environmental Prediction since 2014 and supports severe-weather warning, hydrology, aviation, transportation, and forecast verification across NOAA.
For GribStream users, MRMS occupies a unique place in the catalog: its rapid-update products are our highest-frequency, lowest-latency view of weather actually unfolding. New reflectivity, hail, precipitation-rate, radar-quality, and low-level rotation analyses normally arrive about every two minutes. Forecast models describe what may happen next; MRMS shows how storms are evolving now, with enough temporal detail to follow changes that hourly or even 15-minute data can miss. The one-hour Multi-Sensor QPE Pass 2 product is deliberately later because it waits for additional rain-gauge observations.
From Many Radars to One Three-Dimensional Analysis
Every weather radar has geometric and physical limitations. The beam rises and broadens with distance, terrain can block part of the scan, the cone directly above a radar is poorly sampled, and neighboring radars may observe the same storm from very different angles. Raw returns can also contain ground clutter, anomalous propagation, interference, chaff, insects, birds, and other echoes that do not represent precipitation.
NOAA's MRMS system addresses those problems by combining overlapping radar networks with surface and upper-air observations, lightning, satellite data, and numerical weather prediction fields. Its reflectivity analysis forms a three-dimensional mosaic with 33 vertical levels. Automated quality-control algorithms remove many non-meteorological echoes before the system derives national severe-weather and precipitation products.
The resulting analyses update approximately every two minutes at about one-kilometer spacing over the contiguous United States. Using multiple radars makes the national mosaic more resilient to individual-radar coverage gaps, beam broadening, blockage, and cone-of-silence effects. The result is a spatially coherent view built for operational decision support rather than a simple collection of local radar tiles.
Six Complementary Views of a Storm
The first GribStream release spans storm structure, hail, rainfall, data quality, and low-level rotation:
| GribStream dataset | Product | Cadence and resolution | Scientific role |
|---|---|---|---|
mrms |
Composite reflectivity | About 2 minutes, 0.01 degree | Strongest quality-controlled reflectivity in the vertical column |
mrms |
MESH | About 2 minutes, 0.01 degree | Radar- and temperature-profile-based estimate of maximum hail size |
mrms |
Surface precipitation rate | About 2 minutes, 0.01 degree | Instantaneous radar-derived rainfall rate |
mrms |
Multi-Sensor QPE Pass 2, 1 hour | Hourly, 0.01 degree | Gauge-informed one-hour precipitation accumulation with gap filling |
mrms |
Radar Quality Index | About 2 minutes, 0.01 degree | Spatial context for radar QPE uncertainty from beam sampling and blockage |
mrmsazshear |
0-2 km azimuthal shear | About 2 minutes, 0.005 degree | High-density diagnostic of low-level rotational shear |
These are analyses of what the observing system indicates at a particular time, not forecasts. Their value increases when they are used together and when they are compared with forecast guidance rather than treated as interchangeable hazard scores.
Composite Reflectivity: Storm Structure from the 3D Radar Cube
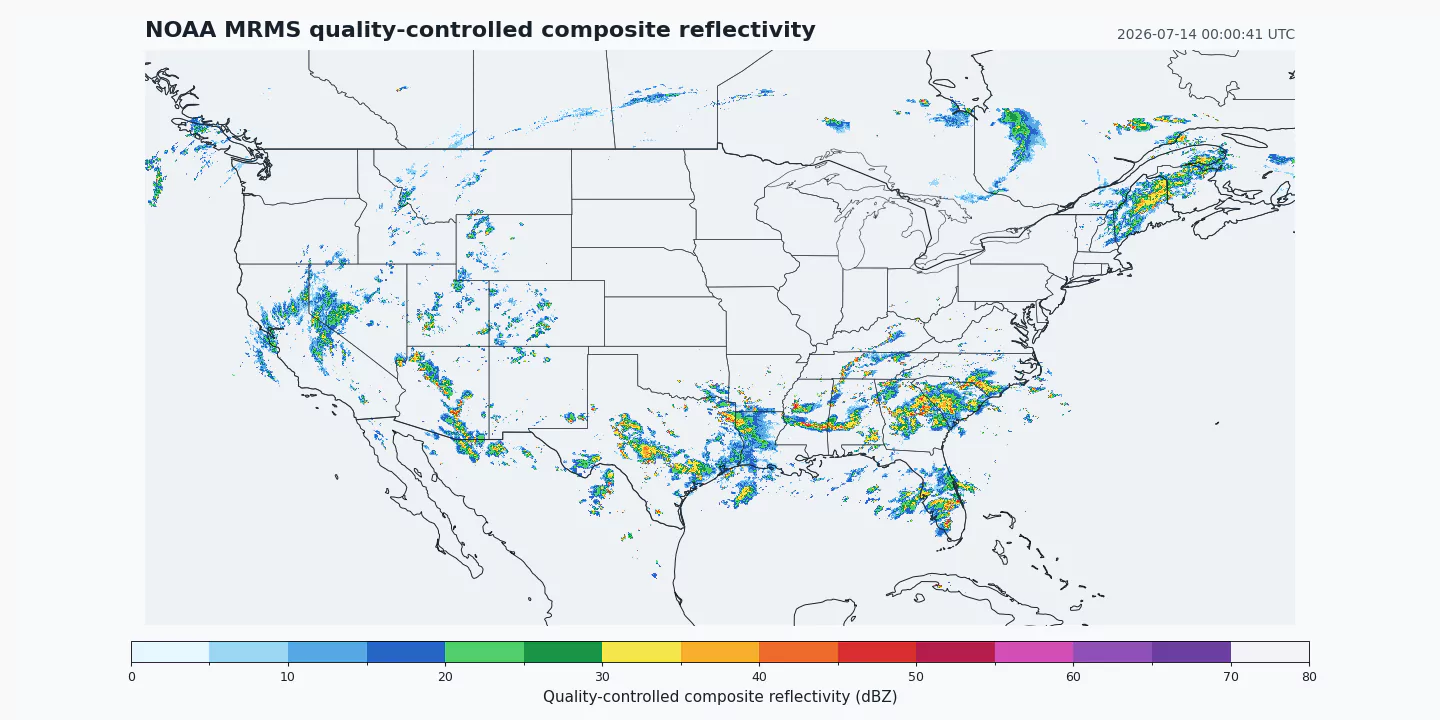
MRMS composite reflectivity takes the maximum quality-controlled reflectivity in each vertical column of the 3D mosaic. This makes deep convective cores, storm overhangs, squall lines, and the broader organization of precipitation easy to follow across radar boundaries.
The product inherits substantial quality control from the 3D reflectivity cube. NOAA documents removal of ground clutter, anomalous propagation, chaff, interference spikes, and biological scatterers. Bright-band contamination from melting snow can remain, and the composite value does not reveal the altitude at which the maximum occurred. It is therefore a powerful national storm-structure field, but not a direct measurement of rainfall at the surface.
MESH: Hail Guidance with Environmental Context
Maximum Estimated Size of Hail (MESH) is derived from the vertical radar structure of a storm and its relationship to environmental temperature levels. The algorithm first evaluates strong reflectivity aloft through the Severe Hail Index, weighting the signal according to its position relative to the 0 C and -20 C levels, and then converts that index into an estimated maximum hail size.
That environmental context is important. Instead of applying one fixed freezing-level height everywhere, MRMS uses mesoscale model analysis to let the temperature profile vary across the country and through time. NOAA and NWS forecasters use MESH to assess the spatial distribution and intensity of hail, and the Storm Prediction Center has used it for real-time diagnosis, forecast verification, and hail climatology research.
MESH remains an estimate, not a surface hail report. NOAA training material documents limitations in highly tilted storms, left-moving supercells, storms with large bounded weak-echo regions, and cases involving low-density hail. It is best used with reflectivity evolution, reports, environmental data, and other severe-weather diagnostics. That distinction matters for warning support, insurance analytics, property-risk monitoring, and post-event hail screening.
Precipitation Rate: Radar Physics at the Melting Layer
The MRMS surface precipitation-rate product is the foundation of the radar quantitative precipitation estimation suite. It does not apply one reflectivity-to-rainfall equation everywhere. MRMS uses radar variables, precipitation classification, and RAP/HRRR environmental profiles to choose rainfall-rate relationships according to where the radar sample lies relative to the melting layer.
Below the melting layer, the system can use dual-polarization relationships that are better suited to liquid precipitation. Within or above that layer, it uses reflectivity-based relationships where the dual-polarization methods are not valid. Version 12 also introduced an evaporation correction intended to reduce false light precipitation and wet bias before hydrometeors reach the ground.
The result is an instantaneous precipitation-rate analysis designed to respond to rapidly changing rainfall intensity. It is useful for monitoring convective rain, feeding short-duration accumulation workflows, comparing radar estimates with gauges, and providing immediate context for flash-flood and transportation applications.
Multi-Sensor QPE Pass 2: Radar, Gauges, Terrain, and Models
One-hour Multi-Sensor QPE Pass 2 answers a different question: how much precipitation accumulated during the previous hour? It combines radar QPE with quality-controlled gauges and supplements weak radar coverage using terrain-aware Mountain Mapper estimates and numerical model precipitation guidance.
NOAA's documented decision tree prefers gauge-bias-corrected radar QPE where radar coverage is good. Radar Quality Index helps determine that confidence. In poor-coverage areas, particularly complex terrain and snow environments, the system can use gauge-derived or model-based estimates and blends the sources spatially to avoid sharp seams. Pass 2 arrives later than Pass 1 because it incorporates more gauge observations; the operational table specifies an hourly update with approximately one hour of latency.
This makes Pass 2 especially useful for hydrologic models, flood forecasting, rainfall-total validation, watershed monitoring, and retrospective comparison with the faster radar-only rate. It should not be confused with the near-real-time precipitation-rate product: one is a later, multi-sensor accumulation, while the other is an instantaneous radar analysis.
Radar Quality Index: Knowing Where Radar QPE Is Strongest
The Radar Quality Index (RQI) describes uncertainty associated with how well radar samples precipitation near the ground. It incorporates terrain blockage and beam geometry, including beam height and width relative to the freezing level. Quality generally decreases where the beam is blocked, samples too high above the surface, or intersects an unfavorable vertical reflectivity profile.
RQI changes with radar scanning strategies, outages, and the atmospheric freezing level. MRMS uses it internally when mosaicking precipitation estimates and when deciding how much weight radar QPE should receive in the multi-sensor blend. For users, it provides an essential map of where radar-derived precipitation is likely to be more or less trustworthy.
It is not a universal accuracy probability. NOAA notes that RQI does not represent errors in the rainfall relationships themselves. It should be read as targeted context for beam-sampling and blockage uncertainty, particularly in mountainous terrain, at long radar ranges, and during low-freezing-level weather.
Azimuthal Shear: A 500-Meter View of Low-Level Rotation
The separate mrmsazshear dataset provides the 0-2 km azimuthal-shear analysis on a 0.005 degree grid, about 555 meters north-south and between about 365 and 504 meters east-west across the domain. That is twice the linear grid density and four times the number of cells of the standard MRMS grid.
NOAA calculates azimuthal shear from individual-radar radial velocity using a Linear Least Squares Derivative method, then blends those fields into a multi-radar CONUS mosaic. The product highlights concentrated cyclonic and anticyclonic velocity gradients in the lowest two kilometers above ground, allowing rotation to be followed across radar boundaries without manually reconciling several single-radar displays.
Azimuthal shear is a diagnostic, not a tornado observation or probability. Values can be influenced by radar geometry, range, convergence, data quality, and how a circulation is sampled. Persistent and spatially coherent shear has the most meaning when interpreted with reflectivity structure, environmental conditions, reports, and official NWS warnings. Used that way, the high-density grid is valuable for severe-weather monitoring, automated feature extraction, alert enrichment, and forecast verification.
Operational and Commercial Uses
MRMS was built for decisions that require a rapid, nationally consistent view of hazardous weather. Its near-real-time cadence can shorten the gap between a storm changing and an application recognizing that change, while its national grids avoid the operational complexity of reconciling individual radar sites. The six products now available through GribStream support several distinct workflows:
- Severe convective weather: follow storm organization, hail potential, and low-level rotation while retaining the limitations of each diagnostic.
- Hydrology and flood operations: combine instantaneous rainfall rate, one-hour multi-sensor accumulation, and RQI to understand both totals and confidence.
- Insurance and property risk: screen hail footprints, prioritize claims response, and compare radar-derived hail signals with reports and insured assets.
- Aviation and transportation: monitor convective structure and intense precipitation across large routing and infrastructure networks.
- Forecast verification: compare observed storm structure, precipitation, and severe-weather diagnostics with HRRR, RAP, and other model guidance.
- Machine learning and event analytics: build high-frequency observational features and labels while avoiding the reporting-density biases present in human storm reports alone.
MRMS complements rather than replaces forecast models. A useful system can place the current radar and multi-sensor analysis beside what a model predicted for the same time and what it expects next. RTMA adds hourly surface meteorological analyses, CCPA provides calibrated hourly precipitation analysis, and NBM supplies blended deterministic and probabilistic forecast guidance.
Accessing MRMS Through GribStream
GribStream preserves NOAA's exact observation timestamps, including seconds, so fast-updating products are not forced onto an artificial clock. The standard products are available through mrms; the denser low-level rotation field is available through mrmsazshear so each is queried on its correct native grid.
Use the model pages for current selectors, coverage, and examples:
mrmsradar, hail, precipitation, and quality inventorymrmsazshearlow-level azimuthal-shear inventory- GribStream API documentation
NOAA makes MRMS data distributed through the NOAA Open Data Dissemination program open for public use and requests attribution when unaltered data are used or redistributed. GribStream identifies NOAA/NSSL as the source and links back to the official dataset documentation.
Authoritative Sources
- NOAA/NSSL MRMS overview: https://www.nssl.noaa.gov/projects/mrms/
- NWS Warning Decision Training Division MRMS Products Guide: https://vlab.noaa.gov/web/wdtd/mrms-products-guide
- NWS composite reflectivity guide: https://vlab.noaa.gov/web/wdtd/-/composite-reflectivity
- NWS MESH guide: https://vlab.noaa.gov/web/wdtd/-/maximum-estimated-size-of-hail-mes-2
- NWS surface precipitation-rate guide: https://vlab.noaa.gov/web/wdtd/-/surface-precipitation-rate-spr-1
- NWS Multi-Sensor QPE guide: https://vlab.noaa.gov/web/wdtd/-/multi-sensor-qpe
- NWS Radar Quality Index guide: https://vlab.noaa.gov/web/wdtd/-/radar-quality-index-rqi-
- NWS azimuthal-shear guide: https://vlab.noaa.gov/web/wdtd/-/azimuthal-she-2
- NOAA MRMS severe-weather and aviation science paper: https://repository.library.noaa.gov/view/noaa/32168
- NOAA MRMS quantitative precipitation science paper: https://repository.library.noaa.gov/view/noaa/15285
- NOAA MRMS open-data registry: https://registry.opendata.aws/noaa-mrms-pds/