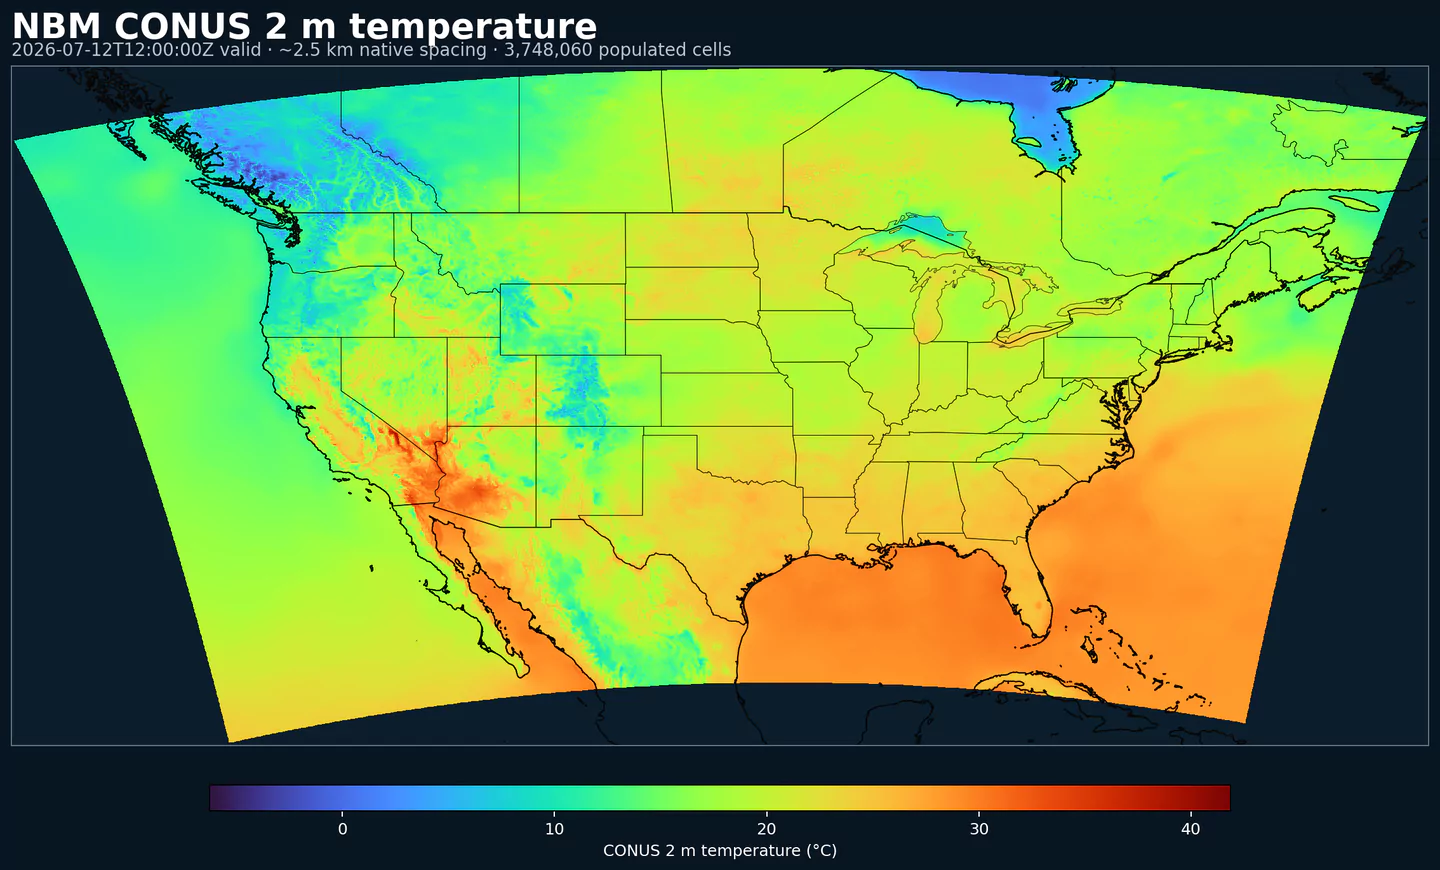
NBM 2 m temperature across the complete populated approximately 2.5 km CONUS product grid shared by these NBM products, with black boundaries. This plot was generated from the nbm dataset.
NBM-v5-Status: NBM v5 ist in diesem Dataset jetzt operativ. Im GribStream-Archiv enthalten Läufe vor 2026-05-05 06:00 UTC die vorherige operative NBM-Version; Läufe ab 2026-05-05 06:00 UTC verwenden NBM v5.
Akkumulationsfelder wie APCP, ASNOW und FICEAC laufen jetzt durch den erweiterten stündlichen Bereich von NBM v5 und gehen danach in /timeseries mit längeren Akkumulationsperioden weiter, ohne Lücken oder doppelte Zeitfenster.
Beschreibung
NBM (National Blend of Models) ist NOAAs wichtigstes Postprocessing-System für Vorhersagen auf Grids über den Vereinigten Staaten. Es kombiniert eine breite Auswahl numerischer Wettermodelle, darunter globale, regionale, deterministische und Ensemble-Systeme, zu einer kalibrierten hochauflösenden Ausgabe.
Die Mischung integriert Vorhersagebasis aus Modellen wie GFS, HRRR, RAP, GEFS und internationalen Systemen wie ECMWF IFS. Ziel ist eine stabile Vorhersage, die Vorhersagegüte über Zeitskalen, Regionen und Variablen ausgleicht, statt von einem einzelnen Modell abhängig zu sein.
Das Blend-Verfahren nutzt statistische Techniken wie Model Output Statistics (MOS), Quantile Mapping und Ensemble-Gewichtung. Die Vorhersagen werden gegen URMA als Verifikationsreferenz bias-korrigiert, was eine konsistentere Ausgabe ermöglicht als ein unkalibriertes Einzelmodell.
NBM veröffentlicht deterministische Felder wie Temperatur, Wind und QPF sowie probabilistische Produkte wie Niederschlagswahrscheinlichkeit, Perzentile und Überschreitungswahrscheinlichkeiten. Dadurch eignet sich NBM besonders für Produkte, die Risiko und Entscheidungen unterstützen müssen.
NBM ist auf konsistente landesweite Vorhersagen ausgelegt, vom Kurzfristbereich bis zu Horizonten von mehreren Tagen, mit stündlichen Aktualisierungen. Das Postprocessing glättet Sprünge zwischen Modellquellen und bietet eine stabile Basis für die digitalen Vorhersagegrids des National Weather Service.
In GribStream steht nbm für das CONUS-Hauptgrid. Es ist eine praktische Wahl, wenn Sie produktnahe Daten mit nationaler Abdeckung, stündlicher Frequenz und stabilerem Verhalten über Zeitskalen hinweg benötigen als bei vielen Einzelmodellen.
Klicken Sie auf einen Parameter, um Varianten in einer kompakten Tabelle mit kopierbaren JSON-Selektoren zu sehen. Codes, Levels und Selector-Werte bleiben exakt so, wie die API sie ausgibt.
Accumulated precipitation represents the total water-equivalent amount of rain and snow during the output period. It is a primary field for hydrologic impacts and event totals.
Units: kg/m^2.
Use with the model time interval to interpret totals and compare to gauges.
Apparent temperature combines air temperature, humidity, and wind to estimate how hot or cold it feels to humans. It is useful for heat and cold stress assessments.
Units: K.
Level
Info
Horizon
Introduced
Selector
2 m above ground
1h-264h
2020-09-29
{"name":"APTMP","level":"2 m above ground","info":""}
Convective Available Potential Energy (CAPE) quantifies buoyant energy available to rising air parcels. Larger values generally imply stronger potential updrafts and greater convective intensity.
Units: J/kg.
Often used with CIN and lifting mechanisms to assess thunderstorm potential.
Ceiling height is the altitude of the lowest cloud base that covers a significant portion of the sky. It is a key aviation and surface-visibility metric.
Craven-Wiedenfeld aggregate severe parameter combines instability and wind shear to indicate severe weather potential. Higher values suggest a higher risk of organized severe storms.
Distance to feature is the horizontal distance to the named hazard or boundary in the source product. It is used to map proximity to key features like fronts or hazards.
Units: km.
Level
Info
Horizon
Introduced
Selector
surface - 610 m above ground
1h-36h
2020-09-29
{"name":"DIST","level":"surface - 610 m above ground","info":""}
Dry thunderstorm probability indicates the chance of thunderstorms with little or no rainfall. It is used for wildfire ignition risk and lightning without wetting rain.
Ellrod index is a diagnostic for clear-air turbulence based on deformation and vertical wind shear. Higher values indicate greater turbulence potential for aviation.
Fosberg fire weather index combines temperature, humidity, and wind to estimate potential fire spread. Higher values indicate more favorable wildfire conditions.
Haines Index combines atmospheric stability and dryness to estimate the potential for large fire growth. Higher values indicate a more favorable environment for extreme fire behavior.
Units: Numeric.
Typically used in wildfire forecasting and risk monitoring.
Level
Info
Horizon
Introduced
Selector
entire atmosphere (considered as a single layer)
6h-264h
2020-09-29
{"name":"HINDEX","level":"entire atmosphere (considered as a single layer)","info":""}
Hourly maximum simulated reflectivity at 1 km AGL captures the strongest modeled reflectivity near the surface. It is used to identify peak convective intensity and heavy precipitation cores.
Units: dBZ.
Level
Info
Horizon
Introduced
Selector
1000 m above ground
1h-48h
2020-09-29
{"name":"MAXREF","level":"1000 m above ground","info":""}
Coded surface precipitation type derived from model precipitation and near-surface thermodynamics. It distinguishes rain, snow, freezing rain, mixed types, and related categories.
Units: coded.
Interpret together with precipitation rate or accumulation.